empty
17.11.2022 01:34 PM
Technical analysis of EUR/USD for November 17, 2022

This image is no longer relevant

Overview :

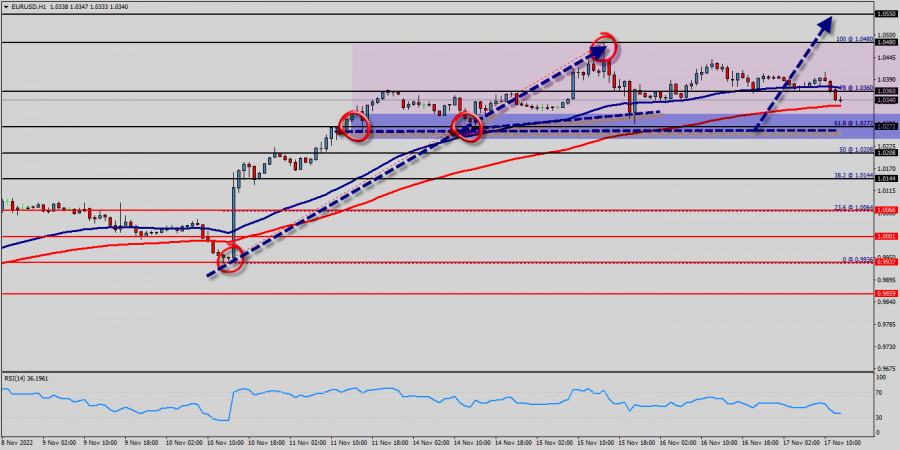
The EUR/USD pair's rise from 1.0272 is still in progress and intraday bias stays on the upside for 1.0272 resistance first on the one-hour chart. All elements being clearly bullish market, it would be possible for traders to trade only long positions on the EUR/USD pair as long as the price remains well above the price of 1.0272. The EUR/USD pair will continue rising from the level of 1.0272 in the long term. It should be noted that the support is established at the level of 1.0272 which represents the daily pivot point. The price is likely to form a double bottom in the same time frame. Accordingly, the EUR/USD pair is showing signs of strength following a breakout of the highest level of 1.0340. This suggests that the pair will probably go up in coming hours.

If the trend is able to break the level of 1.0340, then the market will call for a strong bullish market towards the objectives between 1.0272 ans 1.0480 this week. Currently, the price is in a bullish channel. This is confirmed by the RSI indicator signaling that we are still in a bullish trending market. As the price is still above the moving average (100), immediate support is seen at 1.0272, which coincides with a key ratio (61.8% of Fibonacci). The EUR/USD pair swing around the breached resistance of the bullish channel and keeps its stability above it until now, noticing that the EMA50 continues to resistance the price from above, while RSI begins to overlap positively.

Thus, the market is indicating a bullish opportunity above the above-mentioned support levels, for that the bullish outlook remains the same as long as the 100 EMA is headed to the upside. So, buy above the level of 1.0340 with the first target at 1.0360 in order to test the daily resistance 1. The buyers' bullish objective is set at the level of 1.0480. A bullish break in this resistance would boost the bullish momentum. The buyers could then target the resistance located at 1.0480. If there is any crossing, the next objective would be the resistance located at 1.0480. The level of 1.0550 is a good place to take profits.

Moreover, the RSI is still signaling that the trend is upward as it remains strong above the moving average (100). However, beware of bullish excesses that could lead to a possible short-term correction; but this possible correction would not be tradeable.

On the other hand, in case a reversal takes place and the EUR/USD pair breaks through the support level of 1.0272, a further decline to 1.0208 and 1.0144 can occur. It would indicate a bearish market.

Mourad El Keddani,
الخبير التحليلي لدى شركة إنستافوركس
© 2007-2025
حدد الإطار الزمني
5
د
15
د
30
د
1
س
4
ساعات
1
يوم
1
أسبوع
كسب عائد من تغيرات أسعار العملات المشفرة مع إنستافوركس.
قم بتحميل منصة التداول ميتاتريدر 4 وافتح أول صفقة.
  • Grand Choice
    Contest by
    InstaForex
    InstaForex always strives to help you
    fulfill your biggest dreams.
    انضم إلى المسابقة

المقالات الموصى بها

التوقعات لزوج العملات GBP/USD في 15 أبريل 2025

على الرسم البياني الساعي، استمرت الزوج GBP/USD في الارتفاع يوم الاثنين وأمن موقعًا فوق مستوى 1.3139. وبالتالي، قد يستمر الحركة الصعودية نحو المستوى التصحيحي التالي في فيبوناتشي عند 161.8%

Samir Klishi 11:59 2025-04-15 UTC+2

التوقعات لزوج العملات EUR/USD في 15 أبريل 2025

يوم الاثنين، استمرت الزوج EUR/USD في الارتفاع ولكنه عاد بنهاية اليوم إلى مستوى تصحيح فيبوناتشي 261.8% عند 1.1318. يتيح الارتداد المزدوج من هذا المستوى للمتداولين توقع انعكاس في صالح اليورو

Samir Klishi 11:55 2025-04-15 UTC+2

توقعات الفوركس 15/04/2025: اليورو/الدولار الأمريكي، الجنيه الإسترليني/الدولار الأمريكي، الدولار الأمريكي/الين الياباني، الدولار الأمريكي/الدولار الكندي وبيتكوين

روابط مفيدة: مقالاتي الأخرى متوفرة في هذا القسم دورة InstaForex للمبتدئين التحليلات الشائعة افتح حساب تداول مهم: يجب على المبتدئين في تداول الفوركس أن يكونوا حذرين للغاية عند اتخاذ القرارات

Sebastian Seliga 09:44 2025-04-15 UTC+2

توقعات الفوركس 14/04/2025: اليورو/الدولار الأمريكي، الجنيه الإسترليني/الدولار الأمريكي، الدولار الأمريكي/الين الياباني، الذهب والبيتكوين

روابط مفيدة: مقالاتي الأخرى متوفرة في هذا القسم دورة InstaForex للمبتدئين التحليلات الشائعة افتح حساب تداول مهم: يجب على المبتدئين في تداول الفوركس أن يكونوا حذرين للغاية عند اتخاذ القرارات

Sebastian Seliga 08:54 2025-04-15 UTC+2

التحليل الفني لحركة السعر اللحظية لأزواج العملات المتقاطعة EUR/JPY، الثلاثاء 15 أبريل 2025.

مع ظهور تباين بين حركة سعر زوج العملات المتقاطع EUR/JPY مع مؤشر مذبذب ستوكاستيك، يليه وجود نمط صعودي 123 يليه خطاف روس الصعودي (RH)، بالإضافة إلى أن حركة السعر الحالية

Arief Makmur 07:13 2025-04-15 UTC+2

التحليل الفني لحركة السعر اللحظية لأزواج العملات المتقاطعة GBP/AUD، الثلاثاء 15 أبريل 2025.

على الرسم البياني لمدة 4 ساعات، يبدو أن زوج العملات المتقاطع GBP/AUD يتحرك تحت المتوسط المتحرك الأسي (21) ومؤشر المذبذب العشوائي في حالة بيع متقاطعة، لذلك في المستقبل القريب وبناءً

Arief Makmur 07:13 2025-04-15 UTC+2

إشارات التداول للذهب (XAU/USD) للفترة من 14 إلى 17 أبريل 2024: البيع تحت مستوى 3,224 دولار (+1/8 Murray - 21 SMA)

خطة التداول لدينا للساعات القادمة هي بيع الذهب تحت مستوى 3,224، مع تحديد الأهداف عند 3,203 و3,156. يجب أن نكون متيقظين لأي ارتداد تقني، حيث أن النظرة العامة لا تزال

Dimitrios Zappas 15:59 2025-04-14 UTC+2

التوقعات لليورو/الدولار الأمريكي في 14 أبريل 2025

يوم الجمعة، واصل زوج اليورو/الدولار الأمريكي الارتفاع لكنه تراجع في النصف الثاني من اليوم. كان الانخفاض (أي تقوية الدولار) قصير الأمد، وبحلول نهاية يوم الجمعة، سجل الدولار الأمريكي مرة أخرى

Samir Klishi 12:28 2025-04-14 UTC+2

التوقعات لزوج الجنيه الإسترليني/الدولار الأمريكي في 14 أبريل 2025

على الرسم البياني الساعي، واصل زوج الجنيه الإسترليني/الدولار الأمريكي حركته الصعودية يوم الجمعة، واليوم في طريقه للوصول إلى مستوى 1.3151. الارتداد من هذا المستوى سيفضل الدولار الأمريكي وقد يؤدي

Samir Klishi 12:25 2025-04-14 UTC+2

التحليل الفني لحركة السعر اللحظية لأداة سلعة النفط الخام، الاثنين 24 أبريل 2025.

على الرسم البياني لمدة 4 ساعات لأداة سلعة النفط الخام، يظهر نمط الرأس والكتفين المقلوب ونمط الصعود 123 والتباين بين حركة سعر #CL ومؤشر مذبذب ستوكاستيك، بالإضافة إلى أن حركة

Arief Makmur 07:19 2025-04-14 UTC+2
لا تستطيع التحدث الآن؟
اطرح سؤالك في الدردشة.
Widget callback
 

Dear visitor,

Your IP address shows that you are currently located in the USA. If you are a resident of the United States, you are prohibited from using the services of InstaFintech Group including online trading, online transfers, deposit/withdrawal of funds, etc.

If you think you are seeing this message by mistake and your location is not the US, kindly proceed to the website. Otherwise, you must leave the website in order to comply with government restrictions.

Why does your IP address show your location as the USA?

  • - you are using a VPN provided by a hosting company based in the United States;
  • - your IP does not have proper WHOIS records;
  • - an error occurred in the WHOIS geolocation database.

Please confirm whether you are a US resident or not by clicking the relevant button below. If you choose the wrong option, being a US resident, you will not be able to open an account with InstaForex anyway.

We are sorry for any inconvenience caused by this message.