empty
29.01.2024 10:42 AM
EUR/USD and GBP/USD: trading plan for beginners on January 29

Details of economic calendar on January 26

The economic calendar lacked high-impact data on Friday.

Review of charts on January 26

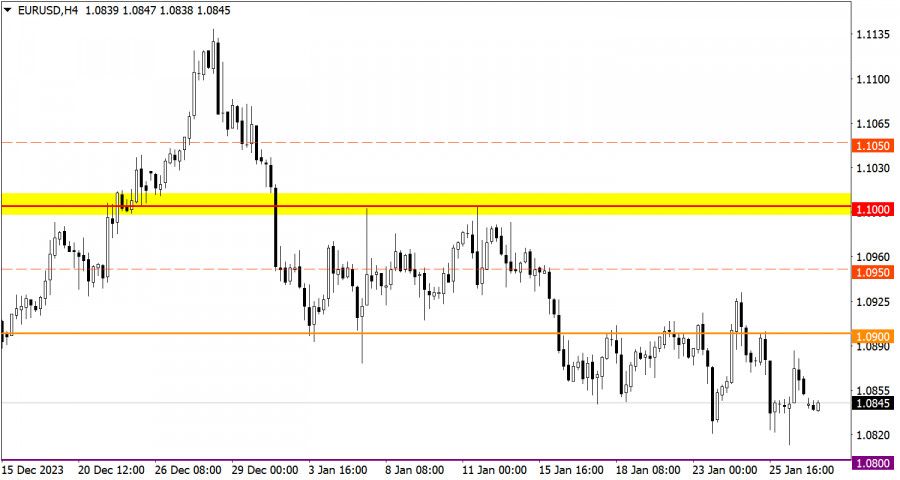
EUR/USD reached the bottom of the correction cycle accompanied by pronounced speculative activity.

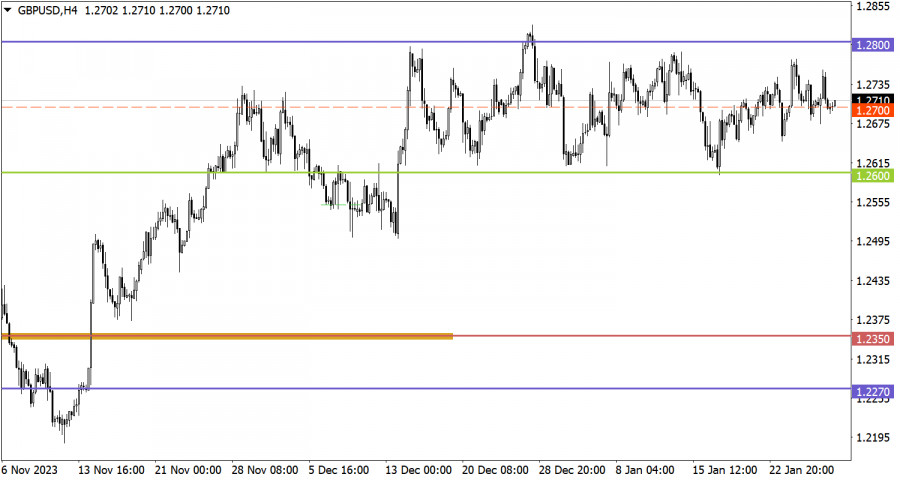
The GBP/USD pair had been trapped within the sideways channel between 1.2600 and 1.2800 for the seventh week in a row. There is periodic speculative activity, but special attention is paid to the middle level of the sideways channel at 1.2700.

This image is no longer relevant

Economic calendar on January 29

Traditionally, the new trading week begins with the empty economic calendar. This is common for Monday. Nevertheless, this week is going to be jam-packed with major events. Two central banks are holding policy meetings. As for macroeconomic data, the market will get to know inflation data for the EU and the US nonfarm payrolls for January.

Trading plan for EUR/USD on January 29

The extension of the downward correction indicates the overall bearish interest among market participants. However, as before, the level of 1.0800 serves as an obstacle for the sellers, which, according to technical analysis, can put pressure on short positions. Thus, the downward cycle is limited to this level, which means some uncertainty in market sentiment. If the price settles below 1.0800 during the day, traders may add short positions.

This image is no longer relevant

Trading plan for GBP/USD on January 29

The median level acts as an indicator of trading interest within the sideways channel. Price stabilization below this level may be followed by a movement towards the lower border of 1.2600. However, all price fluctuations so far fit within the current corridor, which, is still in the making according to technical analysis. A priority strategy among market participants is trading during a breakout of one of the borders of the sideways channel.

This image is no longer relevant

What's on charts

The candlestick chart type consists of graphic rectangles in white and black with lines at the top and bottom. With a detailed analysis of each individual candle, you can see its characteristics relative to a particular time period: opening price, closing price, maximum and minimum price.

Horizontal levels are price coordinates relative to which a price may stop or revered its trajectory. In the market, these levels are called support and resistance.

Circles and rectangles are highlighted examples where the price developed. This color highlighting indicates horizontal lines that may put pressure on the price in the future.

Up/down arrows are guidelines for a possible direction in the future.

Gven Podolsky,
الخبير التحليلي لدى شركة إنستافوركس
© 2007-2025
حدد الإطار الزمني
5
د
15
د
30
د
1
س
4
ساعات
1
يوم
1
أسبوع
كسب عائد من تغيرات أسعار العملات المشفرة مع إنستافوركس.
قم بتحميل منصة التداول ميتاتريدر 4 وافتح أول صفقة.
  • Grand Choice
    Contest by
    InstaForex
    InstaForex always strives to help you
    fulfill your biggest dreams.
    انضم إلى المسابقة

المقالات الموصى بها

كيفية تداول زوج الجنيه الإسترليني/الدولار الأمريكي في 29 أبريل؟ نصائح بسيطة وتحليل التداول للمبتدئين

يوم الاثنين، ارتفع زوج الجنيه الإسترليني/الدولار الأمريكي بمقدار 130 نقطة. كان هذا هو "الاثنين الممل" بدون تقرير اقتصادي كلي أو خطاب مهم. اكتسب الجنيه الإسترليني أكثر من سنت واحد

Paolo Greco 06:43 2025-04-29 UTC+2

كيفية تداول زوج اليورو/الدولار الأمريكي في 29 أبريل؟ نصائح بسيطة وتحليل التداول للمبتدئين

في يوم الاثنين، أظهر زوج العملات EUR/USD تحركات متباينة إلى حد ما، بغض النظر عن كيفية النظر إليه. فمن ناحية، أظهر الزوج حركة صعودية قوية رغم عدم وجود مبرر

Paolo Greco 06:43 2025-04-29 UTC+2

توصيات وتحليل التداول لزوج الجنيه الإسترليني/الدولار الأمريكي في 29 أبريل: الجنيه الإسترليني يعود إلى عاداته القديمة

في يوم الاثنين، تداول زوج العملات GBP/USD مرة أخرى بارتفاع على الرغم من عدم وجود أسباب أساسية لذلك. ومع ذلك، يجب أن يكون جميع المتداولين قد اعتادوا

Paolo Greco 04:32 2025-04-29 UTC+2

توصيات وتحليل التداول لليورو/الدولار الأمريكي في 29 أبريل: نمو اليورو لم يؤثر على الاتجاه العرضي

يوم الاثنين، أظهر زوج العملات EUR/USD حركة صعودية ملحوظة خلال اليوم ولكنه بقي ضمن القناة الجانبية الضيقة بين 1.1312 و1.1414 (خط كيجون-سن). نذكر أن اليورو يتداول بين 1.1274 و1.1457

Paolo Greco 04:32 2025-04-29 UTC+2

GBP/USD: خطة التداول للجلسة الأمريكية في 28 أبريل (تحليل التداولات الصباحية)

في توقعاتي الصباحية، ركزت على مستوى 1.3342 وخططت لاتخاذ قرارات التداول بناءً عليه. دعونا نلقي نظرة على الرسم البياني لمدة 5 دقائق ونرى ما حدث. ارتفع الزوج وحدث اختراق كاذب

Miroslaw Bawulski 19:19 2025-04-28 UTC+2

EUR/USD: خطة التداول للجلسة الأمريكية في 28 أبريل (مراجعة تداولات الصباح)

في توقعاتي الصباحية، ركزت على مستوى 1.1391 وخططت لاتخاذ قرارات التداول بناءً على ذلك. دعونا نلقي نظرة على الرسم البياني لمدة 5 دقائق ونرى ما حدث. على الرغم من وجود

Miroslaw Bawulski 19:07 2025-04-28 UTC+2

كيفية تداول زوج الجنيه الإسترليني/الدولار الأمريكي في 28 أبريل؟ نصائح بسيطة وتحليل التداول للمبتدئين

لم يظهر زوج الجنيه الإسترليني/الدولار الأمريكي أي تحركات مثيرة للاهتمام يوم الجمعة. مثل اليورو، بقي الجنيه البريطاني قريبًا جدًا من نطاق ثابت. ومع ذلك، لا تزال العملة البريطانية تحافظ

Paolo Greco 05:51 2025-04-28 UTC+2

كيفية تداول زوج اليورو/الدولار الأمريكي في 28 أبريل؟ نصائح بسيطة وتحليل التداول للمبتدئين

واصل زوج العملات EUR/USD التداول بشكل جانبي يوم الجمعة. يستمر السوق في تجاهل جميع البيانات الاقتصادية الكلية، وقد أكد الأسبوع الماضي مرة أخرى هذه الحقيقة الواضحة. حتى دون النظر

Paolo Greco 05:51 2025-04-28 UTC+2

توصيات وتحليل التداول لزوج الجنيه الإسترليني/الدولار الأمريكي في 28 أبريل: الجنيه لا يصدق في التهدئة

واصل زوج العملات GBP/USD التداول الجانبي يوم الجمعة، محافظًا على مستوياته القريبة من أعلى مستوياتها في ثلاث سنوات. إن رفض الجنيه الإسترليني حتى لتصحيح طفيف نحو الأسفل يظهر عدم تصديق

Paolo Greco 04:14 2025-04-28 UTC+2

توصيات وتحليل التداول لليورو/الدولار الأمريكي 28 أبريل: استمرار الاتجاه العرضي

واصل زوج العملات EUR/USD التداول بشكل جانبي طوال يوم الجمعة. في النصف الثاني من الأسبوع الماضي، تداول اليورو حصريًا بين المستويات 1.1321 و1.1391، على الرغم من أن القناة الجانبية العامة

Paolo Greco 04:13 2025-04-28 UTC+2
لا تستطيع التحدث الآن؟
اطرح سؤالك في الدردشة.
Widget callback
 

Dear visitor,

Your IP address shows that you are currently located in the USA. If you are a resident of the United States, you are prohibited from using the services of InstaFintech Group including online trading, online transfers, deposit/withdrawal of funds, etc.

If you think you are seeing this message by mistake and your location is not the US, kindly proceed to the website. Otherwise, you must leave the website in order to comply with government restrictions.

Why does your IP address show your location as the USA?

  • - you are using a VPN provided by a hosting company based in the United States;
  • - your IP does not have proper WHOIS records;
  • - an error occurred in the WHOIS geolocation database.

Please confirm whether you are a US resident or not by clicking the relevant button below. If you choose the wrong option, being a US resident, you will not be able to open an account with InstaForex anyway.

We are sorry for any inconvenience caused by this message.