النماذج الفعلية
النماذج هي نماذج رسومية تتشكل في الرسم البياني حسب السعر. وفقا لأحد المسلمات التحليلية الفنية، فإن التاريخ (حركة السعر) يكرر نفسه. ويعني ذلك أن حركات الأسعار غالباً ما تكون متشابهة في نفس الأوضاع مما يجعل من الممكن التنبؤ بزيادة تطوير الوضع الذي يتسم باحتمال كبير.
Actual Patterns
- All
- Double Top
- Flag
- Head and Shoulders
- Pennant
- Rectangle
- Triangle
- Triple top
- All
- #AAPL
- #AMZN
- #Bitcoin
- #EBAY
- #FB
- #GOOG
- #INTC
- #KO
- #MA
- #MCD
- #MSFT
- #NTDOY
- #PEP
- #TSLA
- #TWTR
- AUDCAD
- AUDCHF
- AUDJPY
- AUDUSD
- EURCAD
- EURCHF
- EURGBP
- EURJPY
- EURNZD
- EURRUB
- EURUSD
- GBPAUD
- GBPCHF
- GBPJPY
- GBPUSD
- GOLD
- NZDCAD
- NZDCHF
- NZDJPY
- NZDUSD
- SILVER
- USDCAD
- USDCHF
- USDJPY
- USDRUB
- All
- M5
- M15
- M30
- H1
- D1
- All
- Buy
- Sale
- All
- 1
- 2
- 3
- 4
- 5

On the chart of #KO H1 the Double Top reversal pattern has been formed. Characteristics: the upper boundary 72.67; the lower boundary 71.72; the width of the pattern 95 points
Open chart in a new window
On the chart of the #MA H1 trading instrument, the Triple Top pattern that signals a trend change has formed. It is possible that after formation of the third peak
Open chart in a new window
The Triple Top pattern has formed on the chart of the #MA M30. Features of the pattern: borders have an ascending angle; the lower line of the pattern
Open chart in a new window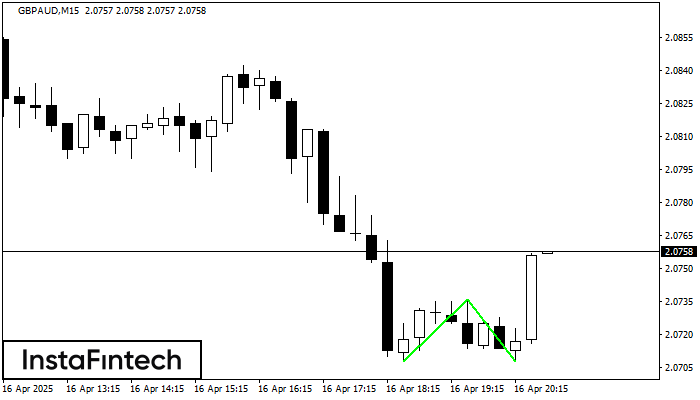
The Double Bottom pattern has been formed on GBPAUD M15; the upper boundary is 2.0736; the lower boundary is 2.0708. The width of the pattern is 28 points. In case
The M5 and M15 time frames may have more false entry points.
Open chart in a new window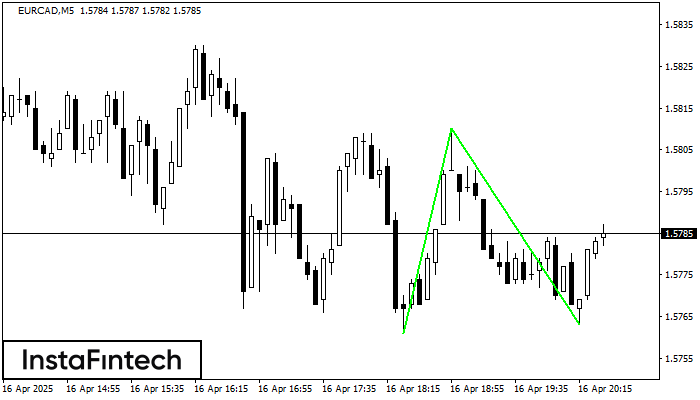
The Double Bottom pattern has been formed on EURCAD M5; the upper boundary is 1.5810; the lower boundary is 1.5763. The width of the pattern is 49 points. In case
The M5 and M15 time frames may have more false entry points.
Open chart in a new window
The Double Bottom pattern has been formed on EURCAD M15. Characteristics: the support level 1.5761; the resistance level 1.5810; the width of the pattern 49 points. If the resistance level
The M5 and M15 time frames may have more false entry points.
Open chart in a new window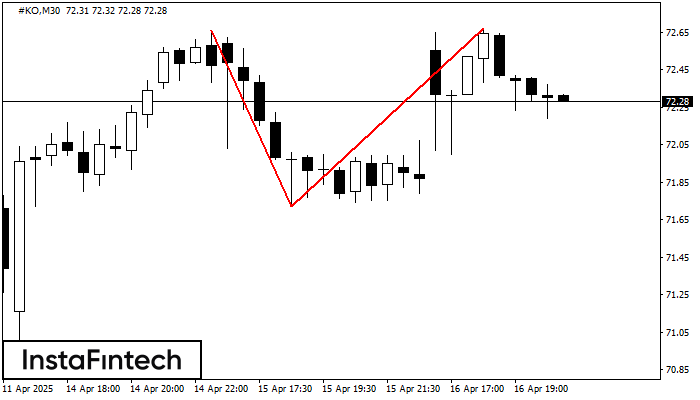
The Double Top pattern has been formed on #KO M30. It signals that the trend has been changed from upwards to downwards. Probably, if the base of the pattern 71.72
Open chart in a new window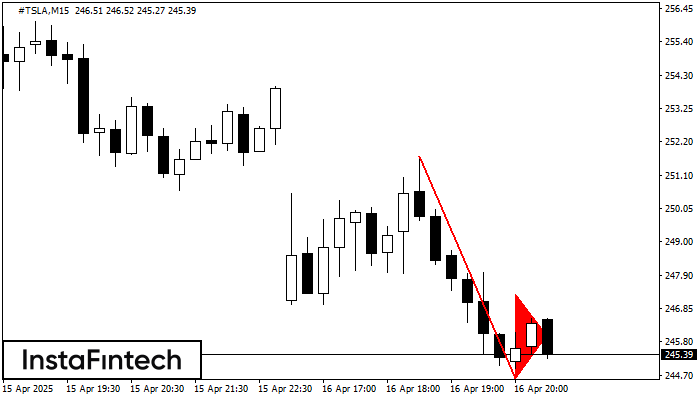
The Bearish pennant pattern has formed on the #TSLA M15 chart. This pattern type is characterized by a slight slowdown after which the price will move in the direction
The M5 and M15 time frames may have more false entry points.
Open chart in a new window
The Bearish pennant pattern has formed on the #TSLA M15 chart. The pattern signals continuation of the downtrend in case the pennant’s low of 244.62 is broken through. Recommendations: Place
The M5 and M15 time frames may have more false entry points.
Open chart in a new window