Analysis of Tuesday's Trades
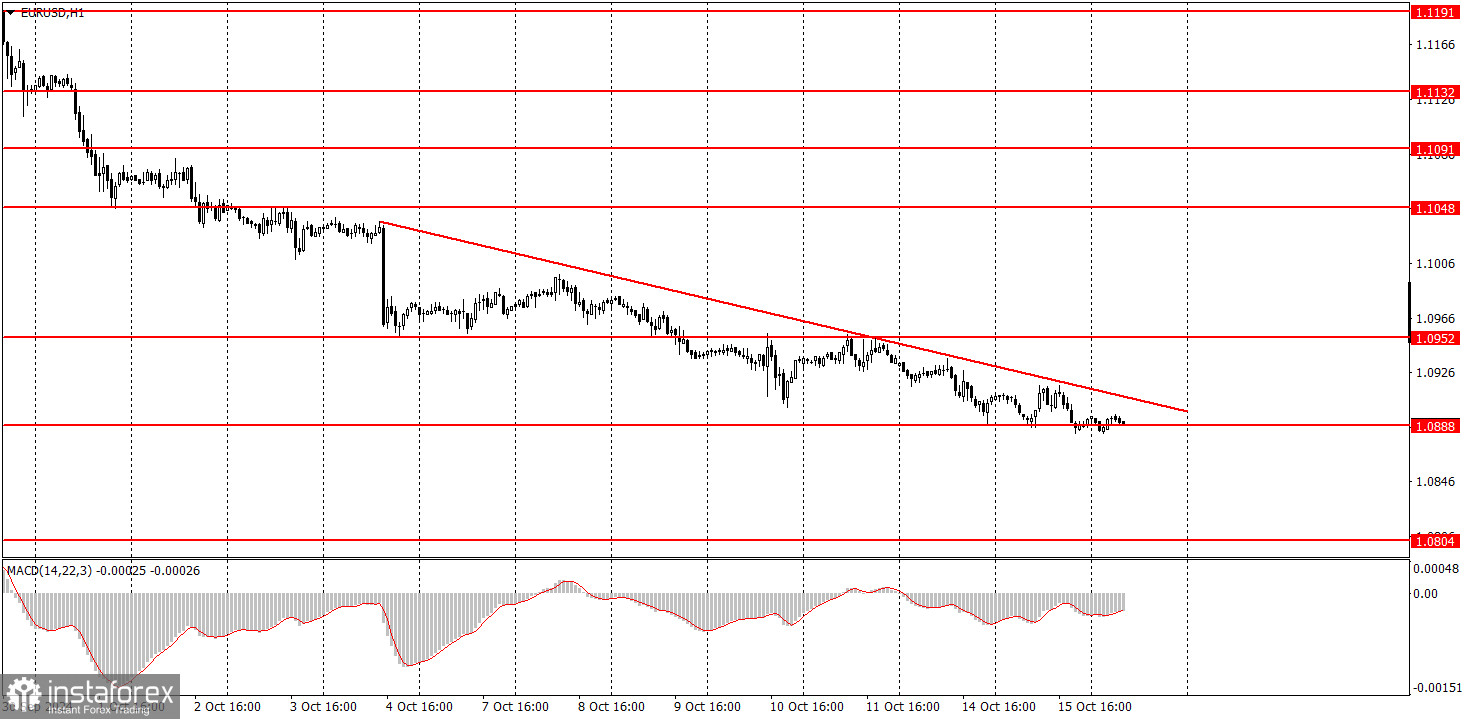
1H Chart of the EUR/USD Pair
On Tuesday, the EUR/USD pair continued its downward movement. Only one report on industrial production in the Eurozone was published throughout the day, which turned out better than expected. This suggested a strengthening of the euro, but instead, we saw another decline in the exchange rate. From our perspective, this is quite logical. The euro had been rising for too long, and the market had ignored all the negative factors for the euro for too long. The US dollar is priced much lower than it should be. That's why we now witness a three-week decline in the pair without a correction. The macroeconomic background has nothing to do with this. Tomorrow, the European Central Bank may lower rates for the third time, which will be more than the rate cuts by the Federal Reserve. The euro could well continue to fall. The descending trendline is relatively formal, but there's no reason to expect an upward correction if the price doesn't break above it.
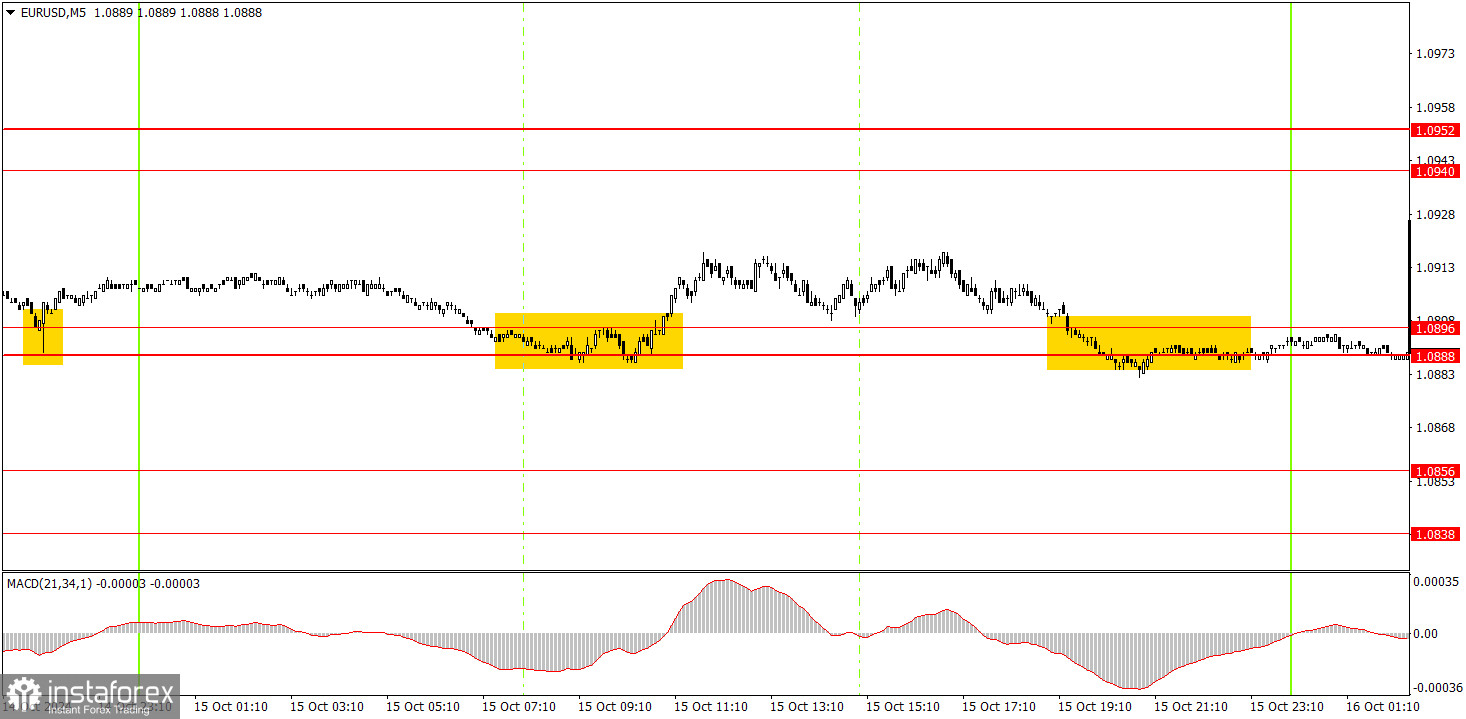
5M Chart of the EUR/USD Pair
On Tuesday, the 5-minute time frame (TF) had one buy signal, but volatility was again very low, and the trend of recent weeks has been downward. Therefore, thinking multiple times before opening buy positions when the pair fell for three weeks was wise. Today, selling the pair would be the most logical option if the price consolidates below the 1.0888-1.0896 area, as short positions remain the most sensible choice.
How to Trade on Wednesday:
The EUR/USD pair has moved significantly toward a new downtrend in the hourly time frame. Unfortunately, similar dollar sales may resume in the medium term, as no one knows how long the market will continue to factor in the Fed's monetary policy easing. However, the downward trend is still present on the hourly TF. A further decline in the euro can be expected, even without a correction, as it remains heavily overbought. However, a correction would make the chart look more balanced.
On Wednesday, trading can be based on the 1.0888-1.0896 area. Movements will likely be weak again, so high profits shouldn't be expected.
On the 5-minute TF, you should consider the following levels: 1.0726-1.0733, 1.0797-1.0804, 1.0838-1.0856, 1.0888-1.0896, 1.0940-1.0951, 1.1011, 1.1048, 1.1091, 1.1132-1.1140, and 1.1189-1.1191. On Wednesday, the only significant event to watch is ECB President Christine Lagarde's speech late in the evening. However, since the ECB meeting will be held tomorrow, it's unlikely that Lagarde will disclose much today.
Basic Rules of the Trading System:
- The strength of a signal is determined by the time it takes to form (bounce or break through a level). The less time it takes, the stronger the signal.
- If two or more trades were opened near a particular level based on false signals, all subsequent signals from that level should be ignored.
- In a flat market, any pair can generate a lot of false signals or none at all. In any case, it's best to stop trading at the first signs of a flat market.
- Trades should be opened during the period between the start of the European session and the middle of the US session, after which all trades should be manually closed.
- In the hourly time frame, it's preferable to trade based on MACD signals only when there is good volatility and a trend confirmed by a trendline or trend channel.
- If two levels are very close to each other (between 5 and 20 pips), they should be treated as a support or resistance zone.
- When moving 15 pips in the intended direction, a Stop Loss should be set to breakeven.
What's on the Charts:
Support and Resistance Price Levels: These levels serve as targets when opening buy or sell positions. They can also be used as points to set Take Profit levels.
Red Lines: These represent channels or trend lines that display the current trend and indicate the preferred trading direction.
MACD Indicator (14,22,3): The histogram and signal line serve as an auxiliary indicator that can also be used as a source of trading signals.
Important Speeches and Reports (always found in the news calendar) can significantly impact the movement of a currency pair. Therefore, trading should be done with maximum caution during their release, or you may choose to exit the market to avoid a sharp price reversal against the preceding movement.
For Beginners Trading on the Forex Market: It's essential to remember that not every trade will be profitable. Developing a clear strategy and practicing money management is key to achieving long-term success in trading.