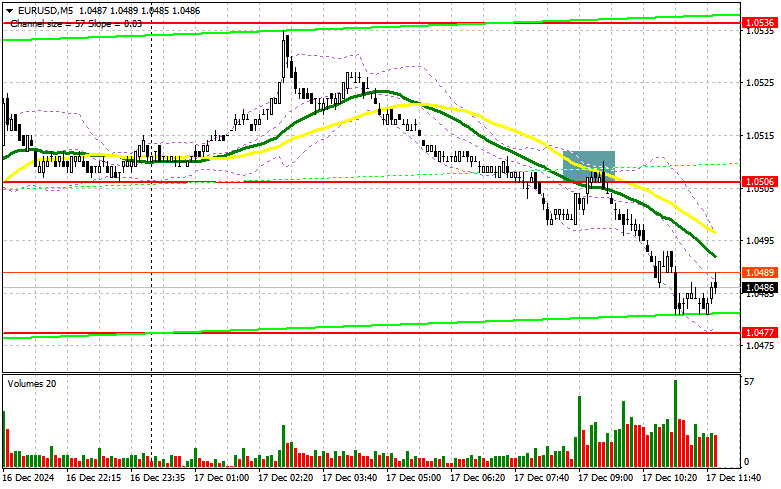
In my morning forecast, I paid attention to the level of 1.0506 and planned to make trading decisions from there. Let's look at the 5-minute chart and analyze what happened. A break and retest of this range from below provided an excellent entry point for selling the euro, which resulted in a decline of over 30 points. The technical picture has been revised for the second half of the day.
To Open Long Positions on EUR/USD:
The IFO data from Germany was very disappointing, as both indicators came in below economists' forecasts. The decline in the business climate index and economic expectations led to a sharp intraday drop in the euro. The second half of the day promises to be equally interesting. Ahead are figures on the change in retail sales and industrial production in the US. A decline in these indicators will hit the US dollar hard, leading to a rise in the pair during the US session. In case of strong data, the euro will fall further, which I intend to take advantage of.
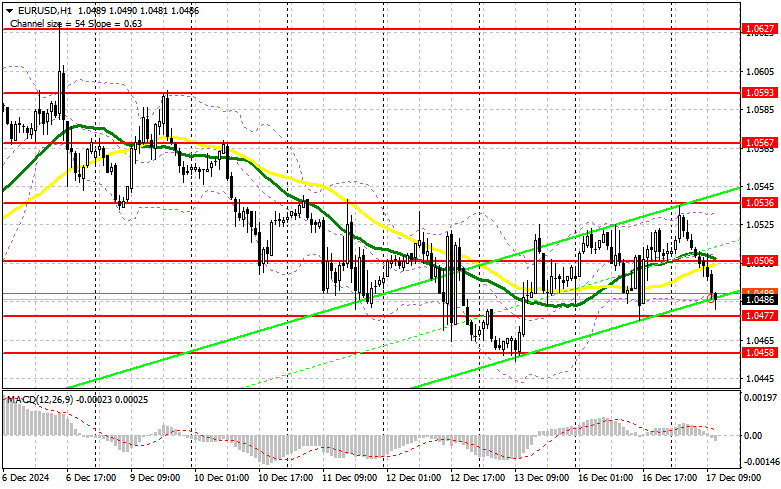
A false breakout near 1.0477, a support formed by yesterday's results, will be a suitable condition for building long positions, aiming for a return to 1.0506.A breakout and retest of this range, similar to the analysis above, will confirm the correct entry point for buying, with a target of 1.0536. The furthest target will be the maximum of 1.0567, where I will take profits. Testing this level will restore bullish market prospects for the euro.
If EUR/USD declines and there is no activity around 1.0477 in the second half of the day, pressure on the pair will only increase, leading to a larger drop. In that case, I will enter only after a false breakout near support at 1.0458. I plan to open long positions immediately on a rebound from 1.0430, targeting a 30-35 point upward correction within the day.
To Open Short Positions on EUR/USD:
If the euro rises on weak US retail sales data, defending resistance at 1.0506, which acted as support this morning, will be a priority for sellers. A false breakout there will restore bearish momentum and provide an entry point for short positions, targeting support at 1.0477. A break and consolidation below this range, followed by a retest from below, will offer another selling opportunity, aiming for the 1.0458 minimum, which will shift the market back in favor of the bears. The furthest target will be the level around 1.0430, where I will take profits.
If EUR/USD rises in the second half of the day and there is no bearish activity near 1.0506, where the moving averages are also located (favoring sellers), I will delay selling until testing the next resistance at 1.0536. I will also sell there, but only after a failed consolidation. I plan to open short positions immediately on a rebound from 1.0567, aiming for a 30-35 point downward correction.
COT Report Analysis:
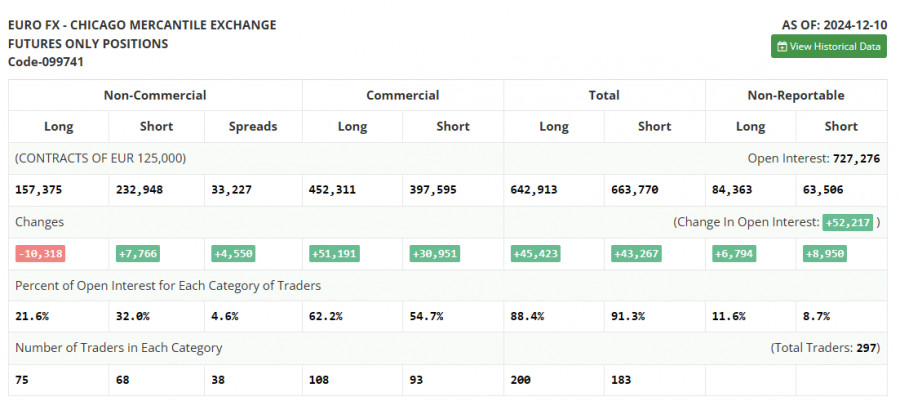
The COT report for December 10 showed a rise in short positions and a reduction in long ones. However, the overall figures kept the balance of power in the market practically unchanged.
- Long non-commercial positions decreased by 10,318 to 157,375.
- Short non-commercial positions increased by 7,766 to 232,948.
- The gap between long and short positions widened by 4,450.
In the near future, the Fed's final meeting of the year will likely result in a decision to cut interest rates, which has recently limited the dollar's growth and supported demand for risky assets. If the Fed adopts a more cautious stance for next year, bearish pressure on EUR/USD will increase significantly.
Indicator Signals:
Moving Averages:
Trading is occurring below the 30- and 50-day moving averages, indicating the pair's continued decline.
Note: The author analyzes moving averages on the H1 hourly chart, which may differ from the classic daily moving averages on the D1 chart.
Bollinger Bands:
In case of a decline, the lower boundary of the indicator around 1.0485 will act as support.
Indicator Descriptions:
- Moving Average (MA): Smooths out volatility and noise to identify the current trend. Period: 50 (yellow line) and 30 (green line).
- MACD (Moving Average Convergence/Divergence): Fast EMA (12), Slow EMA (26), Signal SMA (9).
- Bollinger Bands: Measures price volatility. Period: 20.
- Non-commercial Traders: Speculators such as individual traders, hedge funds, and institutions using the futures market for speculative purposes.
- Long Non-commercial Positions: Total long open positions held by non-commercial traders.
- Short Non-commercial Positions: Total short open positions held by non-commercial traders.
- Net Non-commercial Position: Difference between short and long positions.


