empty
10.02.2025 08:16 AM
Trading Recommendations and Trade Analysis for GBP/USD on February 10th

GBP/USD 5-Minute Chart Analysis

This image is no longer relevant

The GBP/USD pair once again bounced off its ascending trendline on Friday, suggesting a possible continuation of the uptrend.

On Monday, the pair plunged sharply due to Donald Trump's comments, causing a false breakout below the trendline. However, we previously noted that this was a false breakout, and the bullish movement would resume. The Senkou Span B line was tested, further increasing the likelihood of a rebound.

Similar to the euro, the pound does not yet appear to have completed its correction. If the trendline holds, we can expect another corrective upward movement. However, the British pound is struggling, much like the euro, due to weak macroeconomic data from the UK. The Bank of England's policy decision last week prevented further losses, but its tone was more dovish than hawkish. Governor Andrew Bailey refrained from making bold statements about imminent rate cuts, which slightly supported the pound, allowing it to continue its correction for another few weeks.

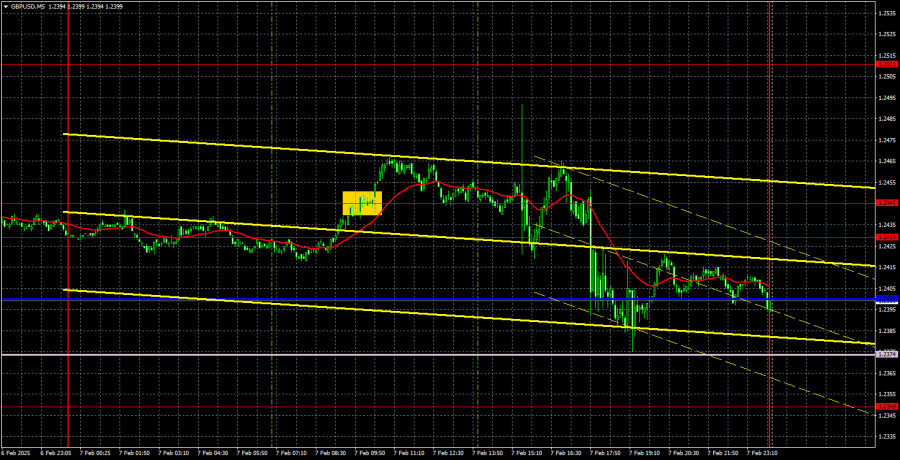
On the 5-minute chart, Friday's movements appeared chaotic. A decent buy signal was formed around 1.2445, but by the start of the US session, it became clear that the rally would not continue. US labor market data was generally strong, confirming that the pound had limited upward potential. Subsequent signals clustered within the 1.2349–1.2445 range, which included multiple Ichimoku indicator levels, making it difficult to trade effectively.

Commitments of Traders (COT) Report

COT reports indicate that the sentiment among commercial traders fluctuates frequently. The red and blue lines, representing the net positions of commercial and non-commercial traders, cross frequently and hover near the zero mark. Currently, these lines remain close to each other, indicating that buy and sell positions are relatively balanced.

On the weekly timeframe, price initially broke above the 1.3154 level, then fell back to the trendline, which was subsequently breached. Breaking the trendline suggests that GBP/USD is likely to continue declining. However, there was also a bounce off the previous local low, suggesting a possible range-bound market (flat movement).

According to the latest COT report, the Non-commercial group closed 16.4K long (buy) positions and 2.9K short (sell) positions. This resulted in a net position decline of 13.5K, which is not positive for the pound.

The fundamental background remains weak for the British pound. There are no strong drivers for long-term GBP strength. The downtrend is likely to persist, and net positioning data suggests waning demand for GBP.

GBP/USD H1 Chart Analysis

The GBP/USD pair remains in a local uptrend despite the trendline breach. However, there is no fundamental reason for the pound's long-term growth. The short-term trend remains bullish, meaning GBP could continue rising in the near term.

On higher timeframes, the bearish trend remains intact, so long-term long positions are not advisable. The British pound's position is not fundamentally strong.

The important levels for GBP/USD trading are: 1.2052, 1.2109, 1.2237–1.2255, 1.2349, 1.2429–1.2445, 1.2511, 1.2605–1.2620, 1.2691–1.2701, 1.2796–1.2816, as well as the Senkou Span B (1.2384) and Kijun-sen (1.2441). Ichimoku lines may shift during the day, so traders should adjust accordingly. Set a Stop Loss to breakeven if the price moves 20 points in the correct direction, to minimize risk from false breakouts.

No significant economic events are scheduled in the UK or the US. As a result, market volatility may remain low, making it difficult for GBP/USD to break key levels like Senkou Span B and the trendline.

Chart Explanations

  • Thick red lines – Major support and resistance levels, where price may reverse.
  • Ichimoku indicator lines (Kijun-sen, Senkou Span B) – Strong support/resistance levels derived from the H4 chart.
  • Thin red lines – Extremes where price has previously reversed. These serve as potential trade signals.
  • Yellow lines – Trendlines, trend channels, and other technical patterns.
  • COT Indicator (on charts) – Shows the net position of each trader category.
Paolo Greco,
Analytical expert of InstaForex
© 2007-2025
Select timeframe
5
min
15
min
30
min
1
hour
4
hours
1
day
1
week
Earn on cryptocurrency rate changes with InstaForex
Download MetaTrader 4 and open your first trade
  • Grand Choice
    Contest by
    InstaForex
    InstaForex always strives to help you
    fulfill your biggest dreams.
    JOIN CONTEST

Recommended Stories

How to Trade the GBP/USD Pair on April 29? Simple Tips and Trade Analysis for Beginners

Analysis of Monday's Trades 1H Chart of GBP/USD On Monday, the GBP/USD pair rose by 130 pips. Such was the "boring Monday" without a macroeconomic report or important speech

Paolo Greco 06:43 2025-04-29 UTC+2

How to Trade the EUR/USD Pair on April 29? Simple Tips and Trade Analysis for Beginners

Analysis of Monday's Trades 1H Chart of EUR/USD On Monday, the EUR/USD currency pair showed somewhat mixed movements, no matter how you look. On the one hand, the pair demonstrated

Paolo Greco 06:43 2025-04-29 UTC+2

Trading Recommendations and Analysis for GBP/USD on April 29: The Pound Sterling Is Back to Its Old Ways

On Monday, the GBP/USD currency pair once again traded higher despite having no fundamental reasons. However, by now, all traders should be accustomed to such developments. While the euro tends

Paolo Greco 04:32 2025-04-29 UTC+2

Trading Recommendations and Analysis for EUR/USD on April 29: Euro Growth Did Not Affect the Flat Trend

On Monday, the EUR/USD currency pair showed a decent upward movement during the day but remained within the narrow sideways channel of 1.1312–1.1414 (Kijun-sen line). Recall that the euro

Paolo Greco 04:32 2025-04-29 UTC+2

GBP/USD: Trading Plan for the U.S. Session on April 28th (Analysis of Morning Trades)

In my morning forecast, I focused on the 1.3342 level and planned to make trading decisions based on it. Let's take a look at the 5-minute chart and see what

Miroslaw Bawulski 19:19 2025-04-28 UTC+2

EUR/USD: Trading Plan for the U.S. Session on April 28th (Review of Morning Trades)

In my morning forecast, I focused on the 1.1391 level and planned to make trading decisions from there. Let's look at the 5-minute chart and see what happened. Although there

Miroslaw Bawulski 19:07 2025-04-28 UTC+2

How to Trade the GBP/USD Pair on April 28? Simple Tips and Trade Analysis for Beginners

Analysis of Friday's Trades 1H Chart of GBP/USD The GBP/USD pair also showed no interesting movements on Friday. Like the euro, the British pound remained very close to a flat

Paolo Greco 05:51 2025-04-28 UTC+2

How to Trade the EUR/USD Pair on April 28? Simple Tips and Trade Analysis for Beginners

Analysis of Friday's Trades 1H Chart of EUR/USD The EUR/USD currency pair continued to trade sideways on Friday. The market continues to ignore all macroeconomic data, and last week once

Paolo Greco 05:51 2025-04-28 UTC+2

Trading Recommendations and Analysis for GBP/USD on April 28: The Pound Does Not Believe in De-escalation

The GBP/USD currency pair continued sideways trading on Friday, holding near three-year highs. The fact that the British pound refuses even a slight downward correction shows the market's disbelief

Paolo Greco 04:14 2025-04-28 UTC+2

Trading Recommendations and Analysis for EUR/USD April 28: The Flat Continues

The EUR/USD currency pair continued trading sideways throughout Friday. In the second half of last week, the euro traded exclusively between the levels of 1.1321 and 1.1391, although the overall

Paolo Greco 04:13 2025-04-28 UTC+2
Can't speak right now?
Ask your question in the chat.
Widget callback
 

Dear visitor,

Your IP address shows that you are currently located in the USA. If you are a resident of the United States, you are prohibited from using the services of InstaFintech Group including online trading, online transfers, deposit/withdrawal of funds, etc.

If you think you are seeing this message by mistake and your location is not the US, kindly proceed to the website. Otherwise, you must leave the website in order to comply with government restrictions.

Why does your IP address show your location as the USA?

  • - you are using a VPN provided by a hosting company based in the United States;
  • - your IP does not have proper WHOIS records;
  • - an error occurred in the WHOIS geolocation database.

Please confirm whether you are a US resident or not by clicking the relevant button below. If you choose the wrong option, being a US resident, you will not be able to open an account with InstaForex anyway.

We are sorry for any inconvenience caused by this message.