实际模式
模式是通过价格在图表中形成的图形模型。 根据其中一项技术分析规定,历史(价格变动)重演。 这意味着价格变动在相同的情况下通常是相似的,这使得有可能以高概率预测情况的进一步发展。
Actual Patterns
- All
- Double Top
- Flag
- Head and Shoulders
- Pennant
- Rectangle
- Triangle
- Triple top
- All
- #AAPL
- #AMZN
- #Bitcoin
- #EBAY
- #FB
- #GOOG
- #INTC
- #KO
- #MA
- #MCD
- #MSFT
- #NTDOY
- #PEP
- #TSLA
- #TWTR
- AUDCAD
- AUDCHF
- AUDJPY
- AUDUSD
- EURCAD
- EURCHF
- EURGBP
- EURJPY
- EURNZD
- EURRUB
- EURUSD
- GBPAUD
- GBPCHF
- GBPJPY
- GBPUSD
- GOLD
- NZDCAD
- NZDCHF
- NZDJPY
- NZDUSD
- SILVER
- USDCAD
- USDCHF
- USDJPY
- USDRUB
- All
- M5
- M15
- M30
- H1
- D1
- All
- Buy
- Sale
- All
- 1
- 2
- 3
- 4
- 5
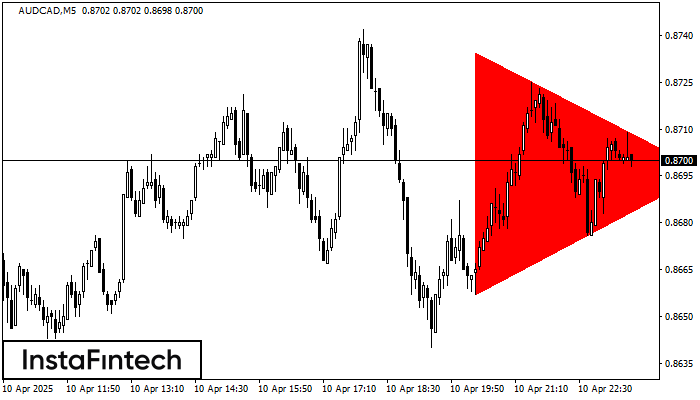
According to the chart of M5, AUDCAD formed the Bearish Symmetrical Triangle pattern. Description: The lower border is 0.8657/0.8696 and upper border is 0.8734/0.8696. The pattern width is measured
The M5 and M15 time frames may have more false entry points.
Open chart in a new window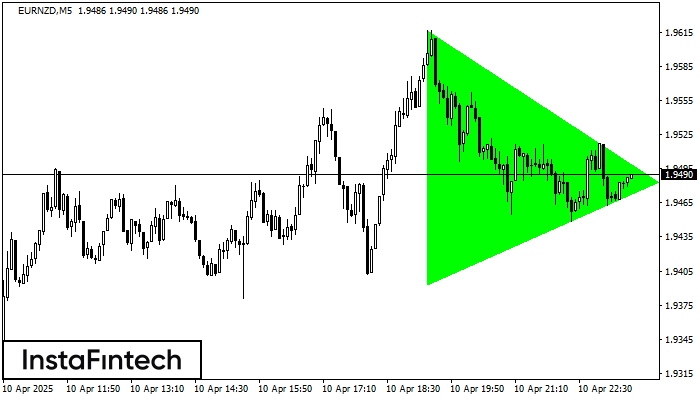
According to the chart of M5, EURNZD formed the Bullish Symmetrical Triangle pattern, which signals the trend will continue. Description. The upper border of the pattern touches the coordinates 1.9617/1.9483
The M5 and M15 time frames may have more false entry points.
Open chart in a new window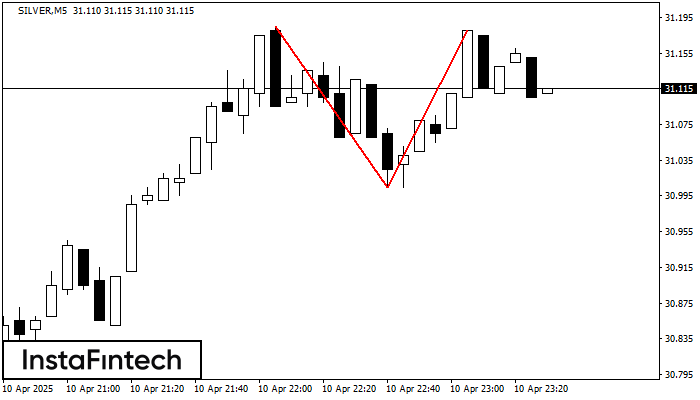
On the chart of SILVER M5 the Double Top reversal pattern has been formed. Characteristics: the upper boundary 31.18; the lower boundary 31.00; the width of the pattern 175 points
The M5 and M15 time frames may have more false entry points.
Open chart in a new window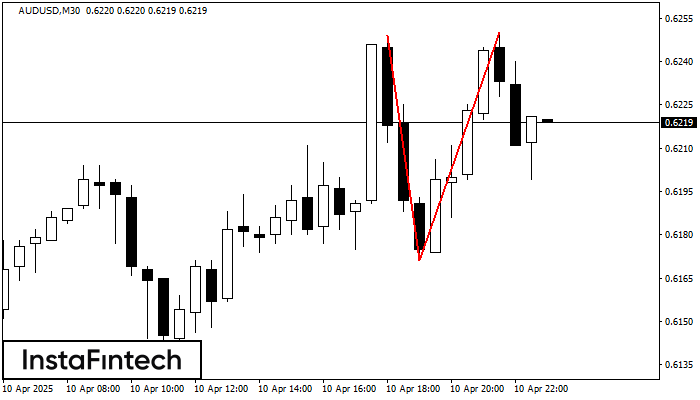
On the chart of AUDUSD M30 the Double Top reversal pattern has been formed. Characteristics: the upper boundary 0.6250; the lower boundary 0.6171; the width of the pattern 79 points
Open chart in a new window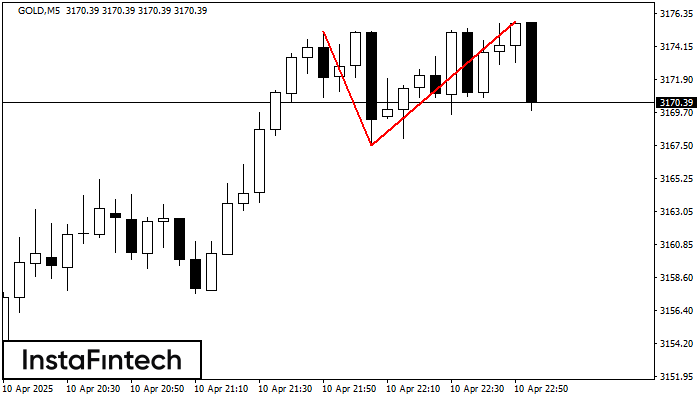
On the chart of GOLD M5 the Double Top reversal pattern has been formed. Characteristics: the upper boundary 3175.82; the lower boundary 3167.51; the width of the pattern 831 points
The M5 and M15 time frames may have more false entry points.
Open chart in a new window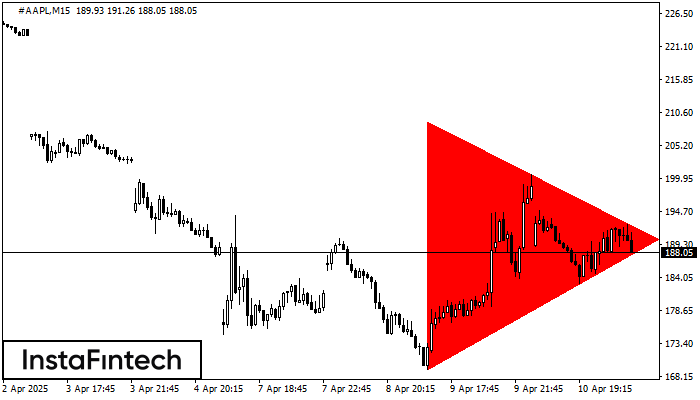
According to the chart of M15, #AAPL formed the Bearish Symmetrical Triangle pattern. This pattern signals a further downward trend in case the lower border 169.19 is breached. Here
The M5 and M15 time frames may have more false entry points.
Open chart in a new window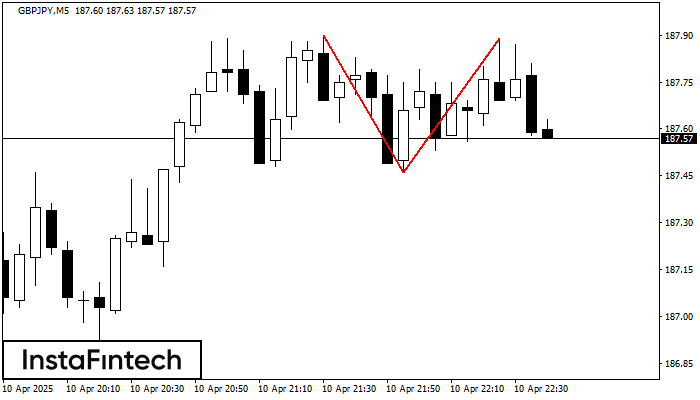
On the chart of GBPJPY M5 the Double Top reversal pattern has been formed. Characteristics: the upper boundary 187.89; the lower boundary 187.46; the width of the pattern 43 points
The M5 and M15 time frames may have more false entry points.
Open chart in a new window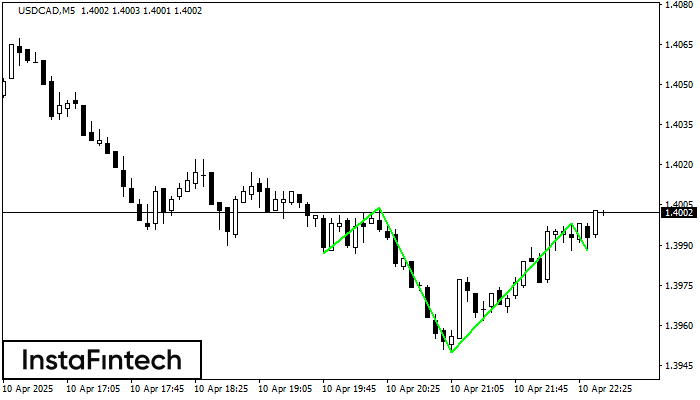
According to M5, USDCAD is shaping the technical pattern – the Inverse Head and Shoulder. In case the Neckline 1.4004/1.3998 is broken out, the instrument is likely to move toward
The M5 and M15 time frames may have more false entry points.
Open chart in a new window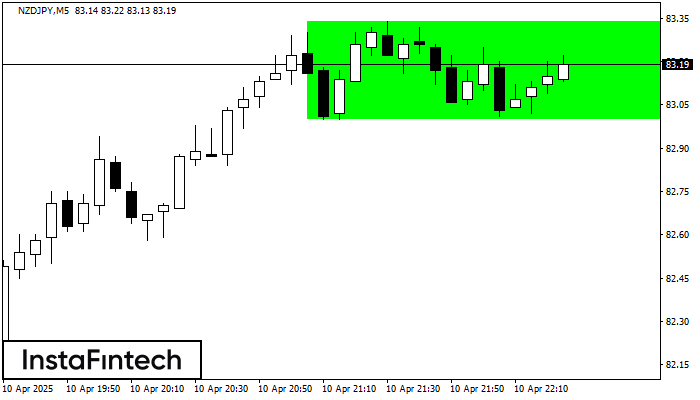
According to the chart of M5, NZDJPY formed the Bullish Rectangle. The pattern indicates a trend continuation. The upper border is 83.34, the lower border is 83.00. The signal means
The M5 and M15 time frames may have more false entry points.
Open chart in a new window