signal strength 1 of 5
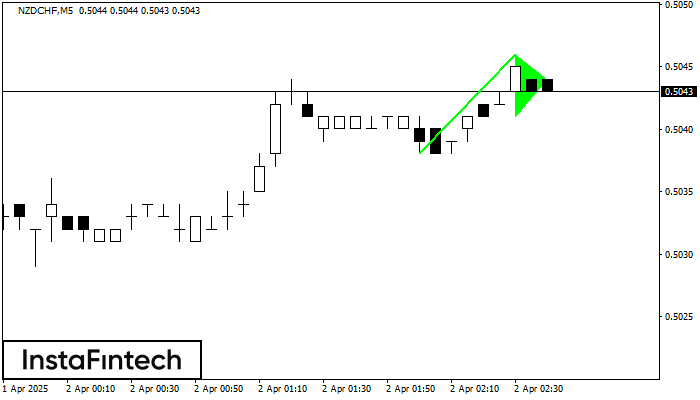
The Bullish pennant graphic pattern has formed on the NZDCHF M5 instrument. This pattern type falls under the category of continuation patterns. In this case, if the quote can breaks out high, is expected to continue the upward trend to level 0.5061.
The M5 and M15 time frames may have more false entry points.
See Also
- All
- Double Top
- Flag
- Head and Shoulders
- Pennant
- Rectangle
- Triangle
- Triple top
- All
- #AAPL
- #AMZN
- #Bitcoin
- #EBAY
- #FB
- #GOOG
- #INTC
- #KO
- #MA
- #MCD
- #MSFT
- #NTDOY
- #PEP
- #TSLA
- #TWTR
- AUDCAD
- AUDCHF
- AUDJPY
- AUDUSD
- EURCAD
- EURCHF
- EURGBP
- EURJPY
- EURNZD
- EURRUB
- EURUSD
- GBPAUD
- GBPCHF
- GBPJPY
- GBPUSD
- GOLD
- NZDCAD
- NZDCHF
- NZDJPY
- NZDUSD
- SILVER
- USDCAD
- USDCHF
- USDJPY
- USDRUB
- All
- M5
- M15
- M30
- H1
- D1
- All
- Buy
- Sale
- All
- 1
- 2
- 3
- 4
- 5
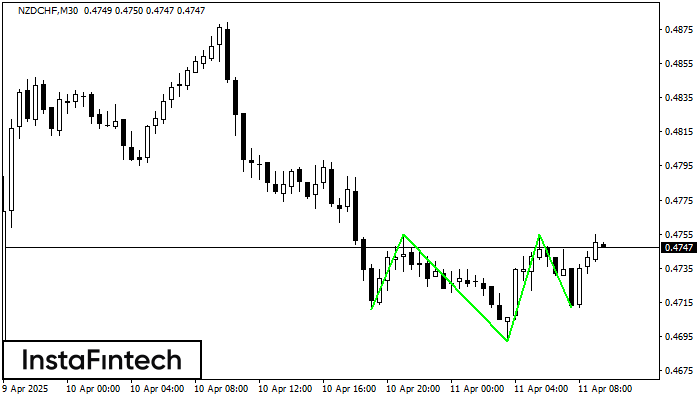
According to M30, NZDCHF is shaping the technical pattern – the Inverse Head and Shoulder. In case the Neckline 0.4755/0.4755 is broken out, the instrument is likely to move toward
Open chart in a new window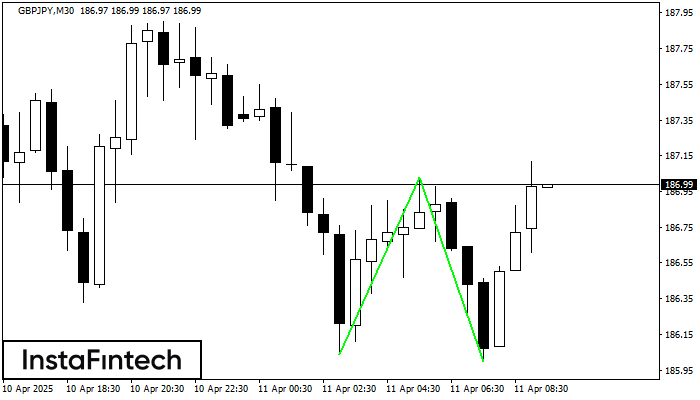
The Double Bottom pattern has been formed on GBPJPY M30. This formation signals a reversal of the trend from downwards to upwards. The signal is that a buy trade should
Open chart in a new window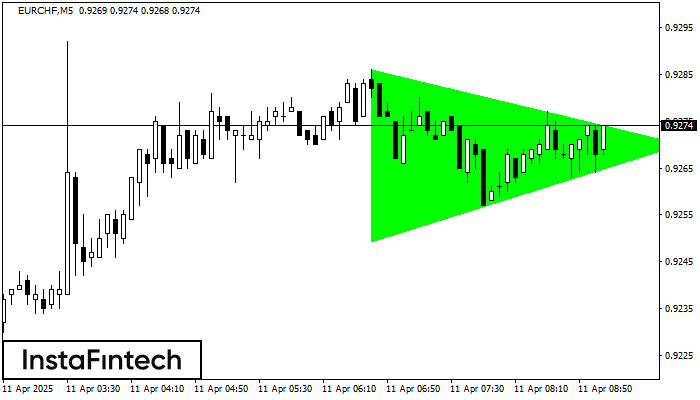
According to the chart of M5, EURCHF formed the Bullish Symmetrical Triangle pattern. The lower border of the pattern touches the coordinates 0.9249/0.9270 whereas the upper border goes across 0.9286/0.9270
The M5 and M15 time frames may have more false entry points.
Open chart in a new window