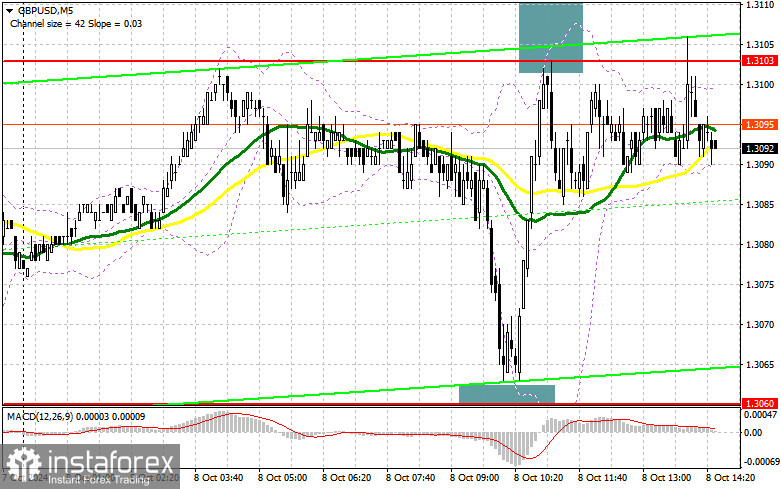
In my morning forecast, I focused on the level of 1.3060 and planned to make market entry decisions based on it. Let's take a look at the 5-minute chart and analyze what happened there. A decline occurred, but it was only a couple of points short of testing the level and forming a false breakout, which left me without any purchases. The false breakout at 1.3103 provided an entry point to sell the pound, but so far, there has not been a significant downward movement in the pair. The technical picture remained unchanged for the second half of the day.
To open long positions on GBP/USD, the following is required:
The balance of trade and the RCM/TIPP Economic Optimism Index are the main statistics we can expect in the second half of the day; thus, all focus will shift to the speeches of FOMC representatives, namely Raphael Bostic and Susan M. Collins. Comments on the recent U.S. labor market report will be interpreted as supportive of a stronger dollar and a weaker pound. For this reason, it's best not to rush into buying. Only a false breakout around 1.3060 will provide a chance for the pair to recover to approximately 1.3103, where the moving averages favor the sellers. A breakout and a retest from the top to the bottom of this range will increase the chances of a bullish trend developing, which will lead to triggering sell stop orders and provide a suitable entry point for long positions with the potential to reach 1.3144. The furthest target will be around 1.3190, where I plan to take profits. If GBP/USD declines and there is a lack of bullish activity at 1.3060 in the second half of the day, pressure on the pair will increase. This will also lead to a decline and a retest of the support at 1.3033. Only a false breakout at that level will be a suitable condition for opening long positions. I plan to buy GBP/USD immediately on a rebound from the minimum of 1.3003 with a target correction of 30-35 points intraday.
To open short positions on GBP/USD, the following is required:
Sellers are present, but not as active as one might expect. If the pair rises again toward the resistance at 1.3103, a false breakout there, similar to what I discussed earlier, will be a suitable option for opening short positions with a target of falling to support at 1.3060. A breakout and retest from the bottom to the top of this range will only occur if there are indications of a less aggressive rate cut from the FOMC representatives. This will also negatively impact buyers' positions, leading to the triggering of stop orders and opening the way to 1.3033. The furthest target will be around 1.3003, where I will take profits. A test of this level will reinforce the bearish sentiment in the market. If GBP/USD rises and there is a lack of activity at 1.3103 in the second half of the day, and this level has already been tested today, buyers will attempt to recover part of the decline. The bears may have to retreat to the resistance level at 1.3144. I will sell there only on a false breakout signal. If there is no downward movement, I will seek short positions on a rebound around 1.3190, but only with the expectation of a downward correction of 30-35 points intraday.
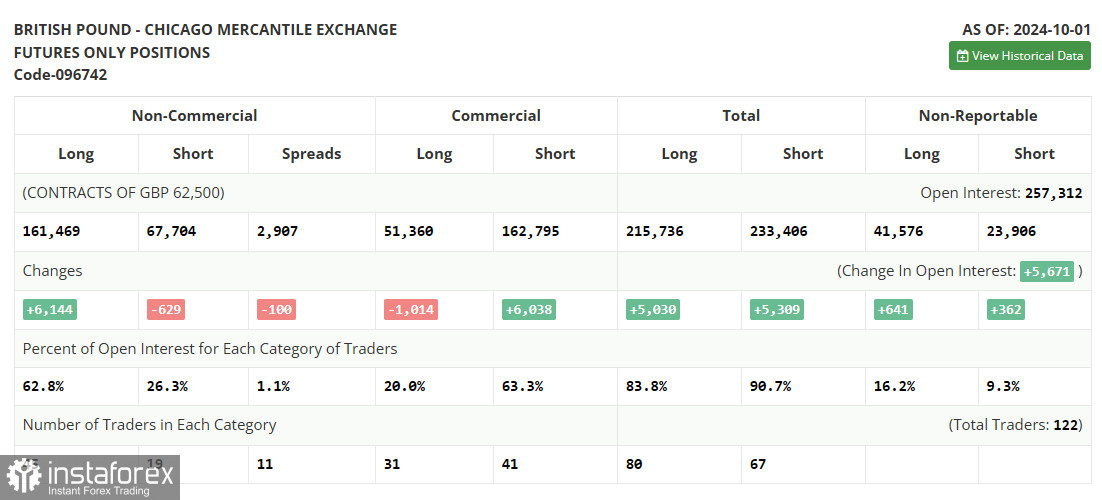
In the COT report (Commitment of Traders) for October 1, there was an increase in long positions and a minimal reduction in short positions. Clearly, the incoming statistics from the UK lately create additional obstacles for further purchases of the pound, but sales are also not on anyone's mind considering the current indicators. However, it should be understood that this report does not take into account the recent changes that occurred in the market at the end of last week after the strong labor market data was released. Therefore, it makes little sense to pay special attention to it. The latest COT report indicates that non-commercial long positions increased by 6,144 to 161,469, while non-commercial short positions decreased by 629 to 67,704. As a result, the gap between long and short positions fell by 100.
Indicator Signals:
Moving Averages
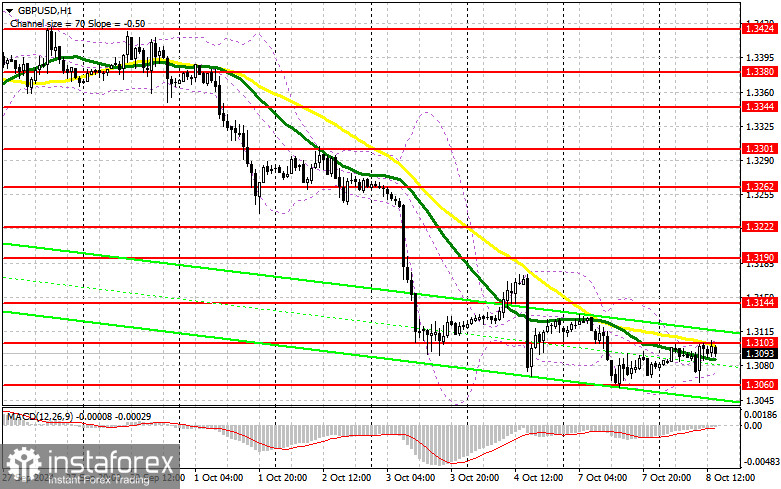
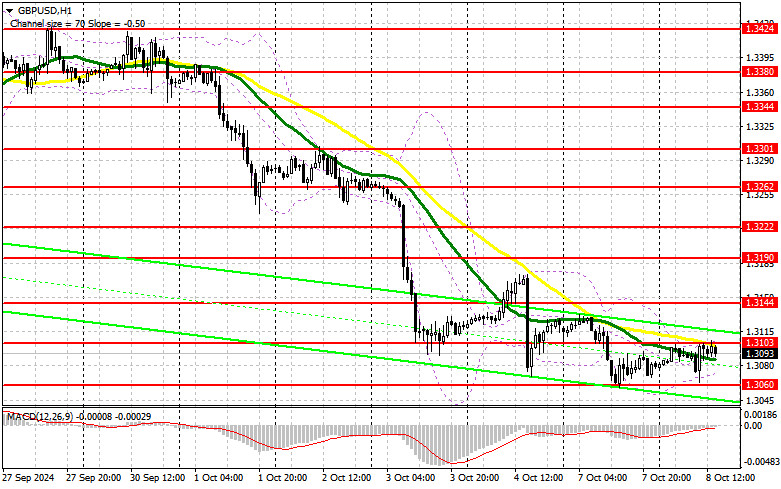
Trading is taking place around the 30 and 50-day moving averages, indicating a sideways market.
Note: The period and prices of the moving averages are considered by the author on the hourly H1 chart and differ from the general definition of classic daily moving averages on the daily D1 chart.
Bollinger Bands
In case of a decline, the lower boundary of the indicator at around 1.3075 will act as support.
Description of Indicators
- Moving Average (determines the current trend by smoothing volatility and noise). Period 50. Marked in yellow on the chart.
- Moving Average (determines the current trend by smoothing volatility and noise). Period 30. Marked in green on the chart.
- MACD Indicator (Moving Average Convergence/Divergence). Fast EMA period 12. Slow EMA period 26. SMA period 9.
- Bollinger Bands. Period 20.
- Non-commercial traders - speculators such as individual traders, hedge funds, and large institutions using the futures market for speculative purposes and meeting certain requirements.
- Long non-commercial positions represent the total long open position of non-commercial traders.
- Short non-commercial positions represent the total short open position of non-commercial traders.
- Total non-commercial net position is the difference between short and long positions of non-commercial traders.