

Actual patterns
Patterns are graphical models which are formed in the chart by the price. According to one of the technical analysis postulates, history (price movement) repeats itself. It means that the price movements are often similar in the same situations which makes it possible to predict the further development of the situation with a high probability.
Actual Patterns
- All
- Double Top
- Flag
- Head and Shoulders
- Pennant
- Rectangle
- Triangle
- Triple top
- All
- #AAPL
- #AMZN
- #Bitcoin
- #EBAY
- #FB
- #GOOG
- #INTC
- #KO
- #MA
- #MCD
- #MSFT
- #NTDOY
- #PEP
- #TSLA
- #TWTR
- AUDCAD
- AUDCHF
- AUDJPY
- AUDUSD
- EURCAD
- EURCHF
- EURGBP
- EURJPY
- EURNZD
- EURRUB
- EURUSD
- GBPAUD
- GBPCHF
- GBPJPY
- GBPUSD
- GOLD
- NZDCAD
- NZDCHF
- NZDJPY
- NZDUSD
- SILVER
- USDCAD
- USDCHF
- USDJPY
- USDRUB
- All
- M5
- M15
- M30
- H1
- D1
- All
- Buy
- Sale
- All
- 1
- 2
- 3
- 4
- 5
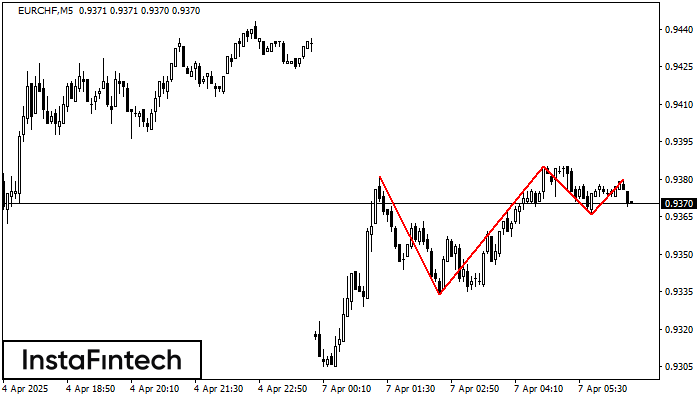
The Triple Top pattern has formed on the chart of the EURCHF M5. Features of the pattern: borders have an ascending angle; the lower line of the pattern
The M5 and M15 time frames may have more false entry points.
Open chart in a new window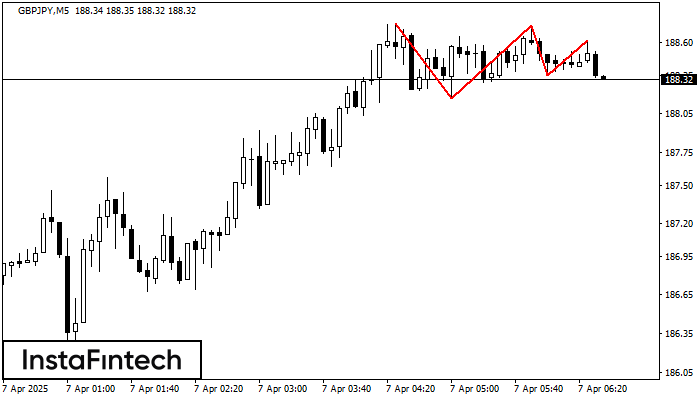
On the chart of the GBPJPY M5 trading instrument, the Triple Top pattern that signals a trend change has formed. It is possible that after formation of the third peak
The M5 and M15 time frames may have more false entry points.
Open chart in a new window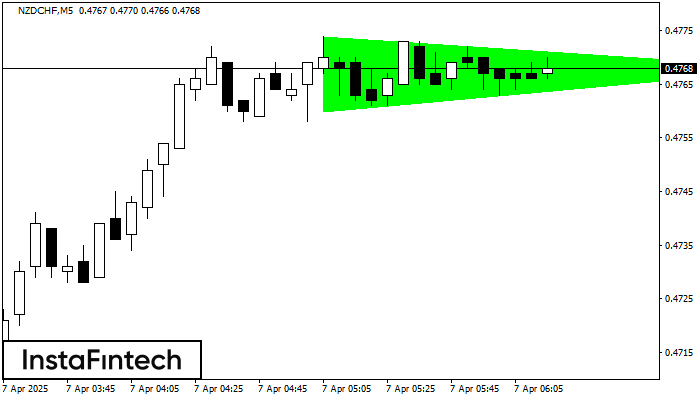
According to the chart of M5, NZDCHF formed the Bullish Symmetrical Triangle pattern. Description: This is the pattern of a trend continuation. 0.4774 and 0.4760 are the coordinates
The M5 and M15 time frames may have more false entry points.
Open chart in a new window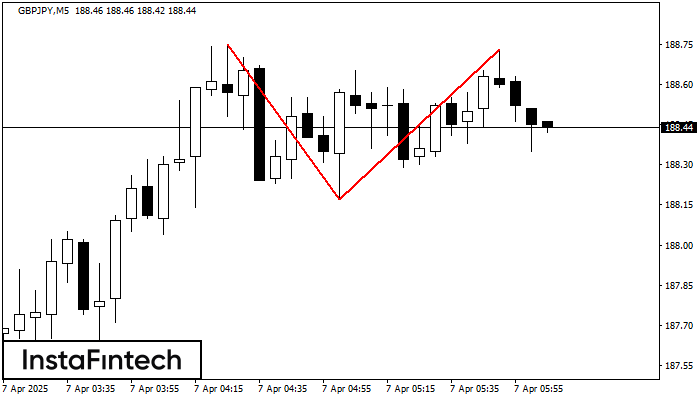
The Double Top reversal pattern has been formed on GBPJPY M5. Characteristics: the upper boundary 188.75; the lower boundary 188.17; the width of the pattern is 56 points. Sell trades
The M5 and M15 time frames may have more false entry points.
Open chart in a new window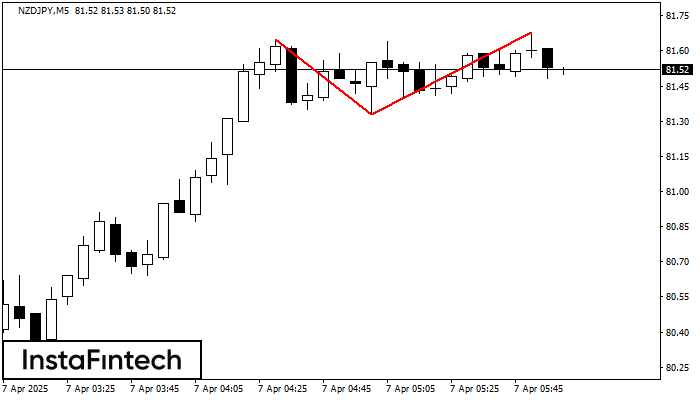
The Double Top pattern has been formed on NZDJPY M5. It signals that the trend has been changed from upwards to downwards. Probably, if the base of the pattern 81.33
The M5 and M15 time frames may have more false entry points.
Open chart in a new window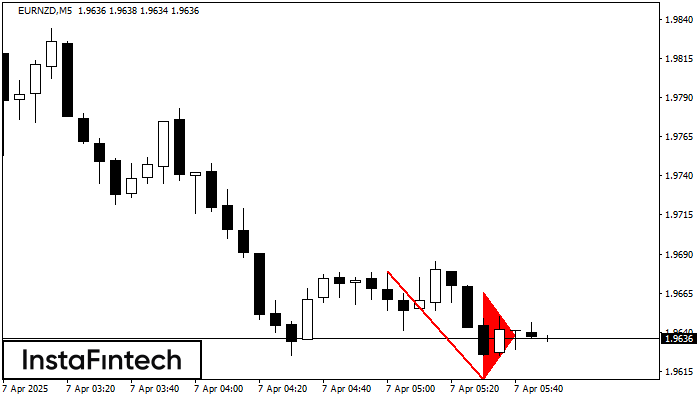
The Bearish pennant pattern has formed on the EURNZD M5 chart. The pattern signals continuation of the downtrend in case the pennant’s low of 1.9609 is broken through. Recommendations: Place
The M5 and M15 time frames may have more false entry points.
Open chart in a new window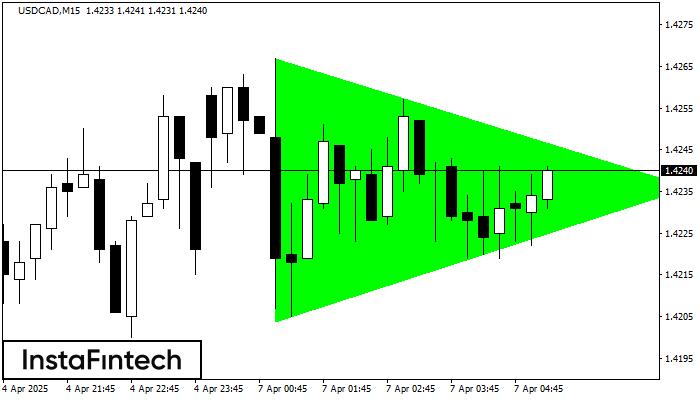
According to the chart of M15, USDCAD formed the Bullish Symmetrical Triangle pattern. Description: This is the pattern of a trend continuation. 1.4267 and 1.4204 are the coordinates
The M5 and M15 time frames may have more false entry points.
Open chart in a new window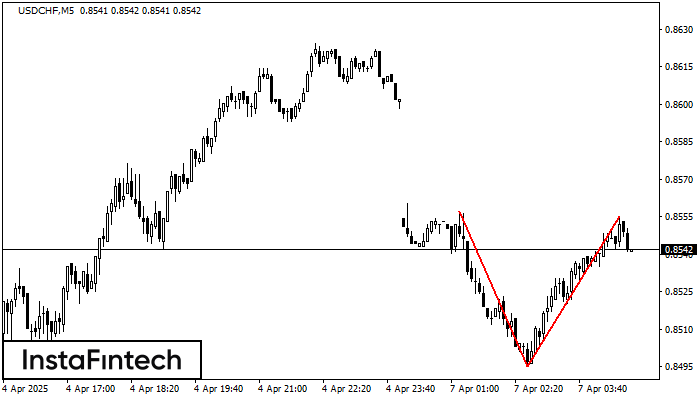
On the chart of USDCHF M5 the Double Top reversal pattern has been formed. Characteristics: the upper boundary 0.8555; the lower boundary 0.8495; the width of the pattern 60 points
The M5 and M15 time frames may have more false entry points.
Open chart in a new window
The Triple Bottom pattern has been formed on GOLD M5. It has the following characteristics: resistance level 3009.08/2992.38; support level 2976.74/2972.63; the width is 3234 points. In the event
The M5 and M15 time frames may have more false entry points.
Open chart in a new window


