empty
01.06.2021 01:52 PM
Forecast for Litecoin on June 1, 2021

This image is no longer relevant

  1. Analysis of volumes for the instrument LTCUSDT from the Binance exchange.
  2. Analysis of the long-term trend.
  3. Analysis of the medium-term trend.
  4. Analysis of the short-term trend.
  5. Japanese candlestick analysis.
  6. Conclusions.
  7. Statistics.

1. Analysis of volumes for the instrument LTCUSDT from the Binance exchange.

This analysis uses data on horizontal volumes from the Binance exchange on daily charts. It is based on the "Footprint-Profile" theory, in which the movement of the level of the maximum horizontal volume per day can indicate the likely direction of the trend. The maximum volume level is the level at which the maximum number of transactions was made, that is, the level of a large player. Accordingly, the upward movement of the maximum volume levels indicates an upward trend. A downward movement of the maximum volume level indicates a downward trend. Chaotic movement of maximum volume levels indicates a flat in the market.

05/30/21 - Maximum horizontal volume level (POC - Point Of Control) - 175

05/31/21 - Maximum horizontal volume level (POC - Point Of Control) - 177

The POC moved upwards, the price is above the POC level. There is an upward movement in the market, so you can consider opening long positions.

2. Analysis of the long-term trend.

A trend is a friend of a trader. Many traders know this saying but don't know how to use it. The answer is simple: trade only in the direction of the trend. This way your trades will have more profit potential with less risk. According to classical Dow theory, there are three main trends:

  • long-term;
  • medium-term;
  • short-term.

You need to analyze these three trends before opening any deal. This is what we will do in this analysis.

The long-term trend in this analysis is the daily trend. Trades will be executed on the daily timeframe and held for several days. The analysis of the daily trend is carried out using the EMA (48) - an exponential moving average with a period of 48. If the daily candle closes above the EMA (48), then we have an upward trend in front of us and you can consider buying. If the daily candle closes below the EMA (48), then the trend is downward and you can consider selling.

This image is no longer relevant

The price is below the EMA (48). The long-term trend is downward, so selling should be considered in this situation.

3. Analysis of the medium-term trend.

In this analysis, the medium-term trend will be the trend on the 4-hour chart (H4). EMA (48), an exponential moving average with a period of 48, will also be used for analysis. If the H4 candlestick closes above the EMA (48), then the trend is upward and you should buy. If the H4 candlestick closes below the EMA (48), then the trend is downward and you should sell.

This image is no longer relevant

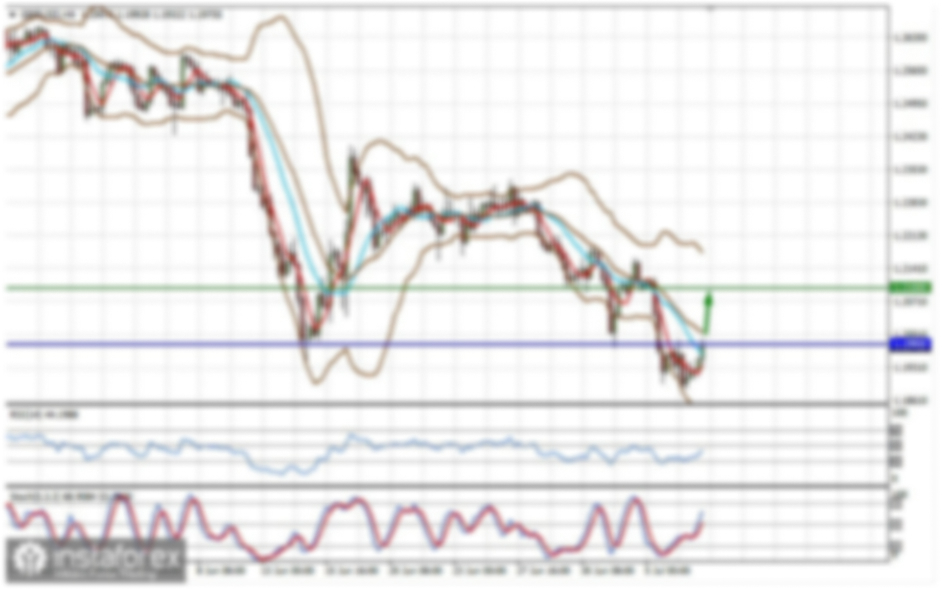
The price is in line with the EMA (48). The medium-term trend is sideways, so you can both buy and sell.

4. Analysis of the short-term trend.

A short-term trend that can show the point of entry into the market well is a trend on the H1 timeframe. We will be helped by the EMA (48) - an exponential moving average with a period of 48. If the H1 candlestick closes above the EMA (48), then the trend is upward and you should buy. If the H1 candlestick closes below the EMA (48), then the trend is downward and you should sell.

This image is no longer relevant

The price is in line with the EMA (48). The short-term trend is sideways, so you can buy and sell. Long-term, medium-term, and short-term trends do not coincide.

5. Japanese candlestick analysis.

Classic Japanese candlestick analysis is applied to the daily timeframe. In this analysis, we will also analyze the daily candlestick.

This image is no longer relevant

The daily candlestick is closed upwards, the candlestick is white. The high is above the high of the previous candle. Candlestick configuration - Hammer pointing up, not large body, large lower shadow. According to the candlestick analysis, you can buy.

6. Conclusions.

  1. Volume analysis - BUY.
  2. Long-term trend - SELL.
  3. Medium-term trend - BUY SELL.
  4. Short-term trend - BUY SELL.
  5. Japanese candlestick analysis - BUY.

General conclusion: On June 1, you can buy and sell, since different types of analysis give different forecasts.

7. Statistics.

To analyze the effectiveness of this approach, statistics are kept on completed transactions. Forecasts and transactions are made in four instruments: Bitcoin, Ethereum, Litecoin, and BCH/USD. The yield is 10.4% in 4 months with a maximum drawdown of 4.88%. Statement:

This image is no longer relevant

I do not open new deals on Litecoin if there is uncertainty in the market

The risk per trade is 1% of the deposit. For new trades, the stop loss is located behind the daily extreme point. We do not set the take profit, since we will accompany the transaction by moving the stop loss beyond the extreme points of the upcoming sessions.

Since trading is carried out on daily charts, this recommendation is relevant throughout the day.

Trade with the trend and you will gain profits!

Pilih carta masa
5
min
15
min
30
min
1
jam
4
jam
1
hari
1
minggu
Jana pendapatan melalui perubahan kadar mata wang kripto dengan InstaForex.
Muat turun MetaTrader 4 dan buka dagangan pertama anda.
  • Grand Choice
    Contest by
    InstaForex
    InstaForex always strives to help you
    fulfill your biggest dreams.
    SERTAI PERADUAN

Artikel yang dicadangkan

Ethereum Jatuh. Bitcoin Kurang Terjejas

Walaupun pelancaran naik taraf ujian Pectra yang berjaya di ujian rangkaian baharu Hoodi—berkemungkinan langkah terakhir sebelum melancarkan kemas kini ke rangkaian utama Ethereum yang bertujuan untuk meningkatkan kebolehskalaan, pegangan

Jakub Novak 08:01 2025-03-28 UTC+2

Tip Dagangan untuk pasaran kripto pada 28 Mac

Bitcoin dan Ethereum sedang bergelut untuk terus bertahan. Usaha Bitcoin yang gagal sekali lagi untuk kekal di paras $88,000 menyebabkan ia dijual semasa sesi dagangan Asia hari ini. Ethereum mengalami

Miroslaw Bawulski 07:34 2025-03-28 UTC+2

Rang Undang-Undang Peraturan Kripto AS Bergerak Maju dengan Pantas

Penggubal undang-undang di AS sedang bergerak pantas untuk meluluskan undang-undang yang bertujuan mengawal selia aset digital. Pengundian bagi rang undang-undang stablecoin dan versi disemak semula bagi rang undang-undang struktur pasaran

Jakub Novak 10:52 2025-03-27 UTC+2

Analisis BTC/USD. 27 Mac. Bitcoin kekurangan potensi pertumbuhan

Struktur gelombang pada carta 4 jam BTC/USD adalah agak jelas. Selepas menyempurnakan aliran menaik yang terdiri daripada lima gelombang penuh, satu fasa pembetulan menurun telah bermula dan kini mengambil bentuk

Chin Zhao 08:31 2025-03-27 UTC+2

Cadangan Dagangan untuk Pasaran Mata Wang Kripto pada 27 Mac

Bitcoin dan Ethereum menghadapi cabaran dalam mengekalkan momentum kenaikan mereka. Walau bagaimanapun, ini nampaknya lebih kepada reaksi terhadap kenyataan politik terkini Donald Trump—yang menyebabkan penurunan permintaan untuk aset berisiko—daripada sesuatu

Miroslaw Bawulski 08:06 2025-03-27 UTC+2

Analisis Teknikal Pergerakan Harga Intraday Matawang Kripto Ethereum, Khamis 27 Mac 2025.

Sekiranya dalam beberapa hari akan datang tiada pengukuhan ketara berlaku—terutamanya jika harga gagal menembusi dan ditutup di atas paras 2549.05 pada carta harian Ethereum—maka ini adalah petunjuk bahawa Ethereum akan

Arief Makmur 06:36 2025-03-27 UTC+2

Analisis Teknikal Pergerakan Harga Harian Matawang Kripto Filecoin, Khamis 27 Mac 2025.

Dengan berjaya menembusi garis bawah saluran Rising Wedge mata wang kripto Filecoin pada carta 4-jamnya dan pergerakan harganya kini tersekat di EMA (21) yang turut mempunyai cerun ke bawah, berdasarkan

Arief Makmur 06:36 2025-03-27 UTC+2

Cadangan Dagangan untuk Pasaran Mata Wang Kripto pada 26 Mac

Bitcoin dan Ethereum terus menunjukkan pertumbuhan aktif tetapi berdepan cabaran dalam mengatasi paras rintangan utama. Semalam, Bitcoin mengalami penurunan selepas mencapai $88,400 dan kini didagangkan sekitar $87,600. Ethereum juga mengalami

Miroslaw Bawulski 08:22 2025-03-26 UTC+2

Mengapa Kejatuhan Bitcoin Masih Belum Berakhir

Walaupun pasaran mata wang kripto telah mencatatkan pertumbuhan baru-baru ini, prospek kenaikan yang lebih besar dan kemungkinan Bitcoin kembali ke paras $100,000 masih dianggap tidak realistik buat masa ini. Perkara

Jakub Novak 10:00 2025-03-25 UTC+2

Cadangan Dagangan untuk Pasaran Kripto pada 25 Mac

Bitcoin dan Ethereum telah mencapai tahap yang penting tetapi gagal mengekalkannya. Bitcoin naik ke $88,600 sebelum mengalami penarikan semula dan kini didagangkan sekitar $86,600. Ethereum juga mengalami pembetulan selepas satu

Miroslaw Bawulski 08:26 2025-03-25 UTC+2
Tidak boleh bertanya sekarang?
Tanya soalan anda di Ruangan bersembang.
Panggilan semula Widget
 

Dear visitor,

Your IP address shows that you are currently located in the USA. If you are a resident of the United States, you are prohibited from using the services of InstaFintech Group including online trading, online transfers, deposit/withdrawal of funds, etc.

If you think you are seeing this message by mistake and your location is not the US, kindly proceed to the website. Otherwise, you must leave the website in order to comply with government restrictions.

Why does your IP address show your location as the USA?

  • - you are using a VPN provided by a hosting company based in the United States;
  • - your IP does not have proper WHOIS records;
  • - an error occurred in the WHOIS geolocation database.

Please confirm whether you are a US resident or not by clicking the relevant button below. If you choose the wrong option, being a US resident, you will not be able to open an account with InstaForex anyway.

We are sorry for any inconvenience caused by this message.