


Padrões atuais
Padrões são modelos gráficos que são formados no gráfico pelo preço. Segundo um dos postulados da análise técnica, a história (movimento de preços) se repete. Isso significa que os movimentos de preços geralmente são semelhantes nas mesmas situações, o que possibilita prever o desenvolvimento futuro da situação com alta probabilidade.
Actual Patterns
- All
- Double Top
- Flag
- Head and Shoulders
- Pennant
- Rectangle
- Triangle
- Triple top
- All
- #AAPL
- #AMZN
- #Bitcoin
- #EBAY
- #FB
- #GOOG
- #INTC
- #KO
- #MA
- #MCD
- #MSFT
- #NTDOY
- #PEP
- #TSLA
- #TWTR
- AUDCAD
- AUDCHF
- AUDJPY
- AUDUSD
- EURCAD
- EURCHF
- EURGBP
- EURJPY
- EURNZD
- EURRUB
- EURUSD
- GBPAUD
- GBPCHF
- GBPJPY
- GBPUSD
- GOLD
- NZDCAD
- NZDCHF
- NZDJPY
- NZDUSD
- SILVER
- USDCAD
- USDCHF
- USDJPY
- USDRUB
- All
- M5
- M15
- M30
- H1
- D1
- All
- Buy
- Sale
- All
- 1
- 2
- 3
- 4
- 5

On the chart of #KO H1 the Double Top reversal pattern has been formed. Characteristics: the upper boundary 72.67; the lower boundary 71.72; the width of the pattern 95 points
Open chart in a new window
On the chart of the #MA H1 trading instrument, the Triple Top pattern that signals a trend change has formed. It is possible that after formation of the third peak
Open chart in a new window
The Triple Top pattern has formed on the chart of the #MA M30. Features of the pattern: borders have an ascending angle; the lower line of the pattern
Open chart in a new window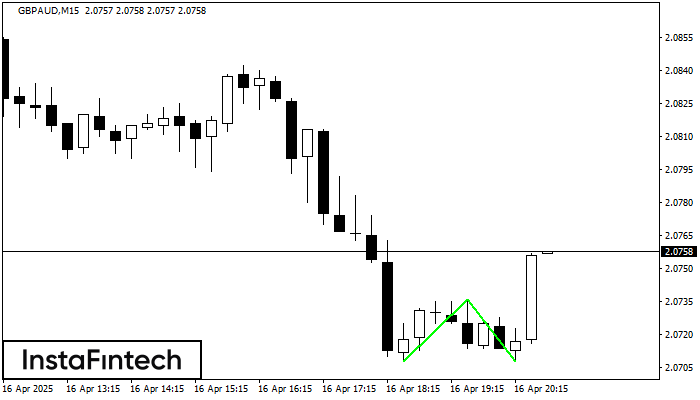
The Double Bottom pattern has been formed on GBPAUD M15; the upper boundary is 2.0736; the lower boundary is 2.0708. The width of the pattern is 28 points. In case
The M5 and M15 time frames may have more false entry points.
Open chart in a new window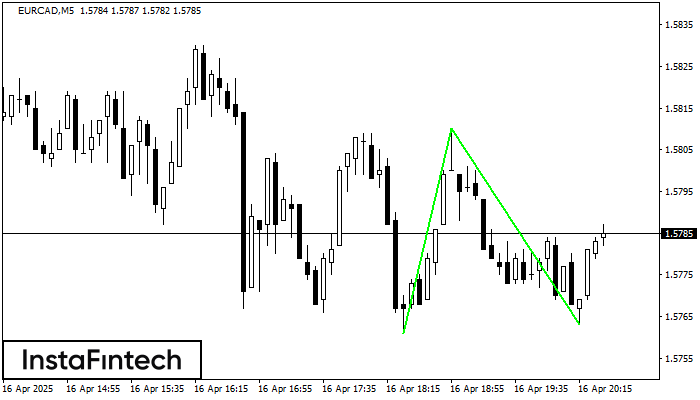
The Double Bottom pattern has been formed on EURCAD M5; the upper boundary is 1.5810; the lower boundary is 1.5763. The width of the pattern is 49 points. In case
The M5 and M15 time frames may have more false entry points.
Open chart in a new window
The Double Bottom pattern has been formed on EURCAD M15. Characteristics: the support level 1.5761; the resistance level 1.5810; the width of the pattern 49 points. If the resistance level
The M5 and M15 time frames may have more false entry points.
Open chart in a new window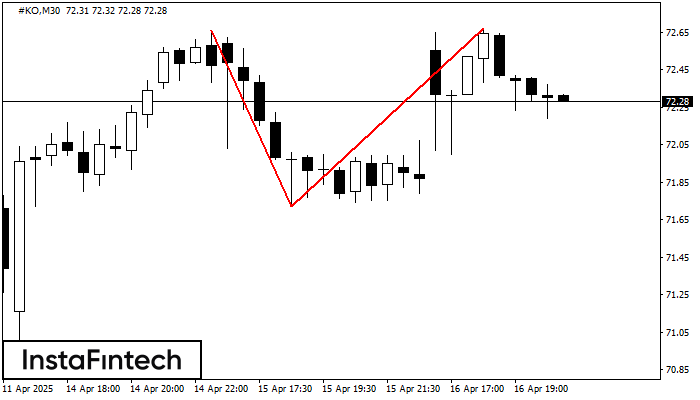
The Double Top pattern has been formed on #KO M30. It signals that the trend has been changed from upwards to downwards. Probably, if the base of the pattern 71.72
Open chart in a new window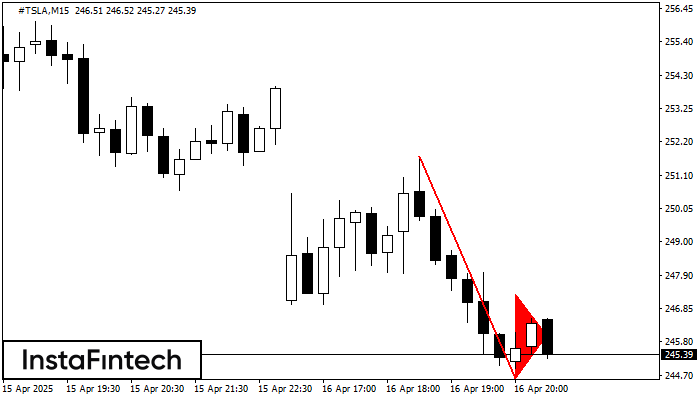
The Bearish pennant pattern has formed on the #TSLA M15 chart. This pattern type is characterized by a slight slowdown after which the price will move in the direction
The M5 and M15 time frames may have more false entry points.
Open chart in a new window
The Bearish pennant pattern has formed on the #TSLA M15 chart. The pattern signals continuation of the downtrend in case the pennant’s low of 244.62 is broken through. Recommendations: Place
The M5 and M15 time frames may have more false entry points.
Open chart in a new window


