signal strength 3 of 5

The Double Bottom pattern has been formed on NZDCAD M30; the upper boundary is 0.8209; the lower boundary is 0.8165. The width of the pattern is 43 points. In case of a break of the upper boundary 0.8209, a change in the trend can be predicted where the width of the pattern will coincide with the distance to a possible take profit level.
- All
- Double Top
- Flag
- Head and Shoulders
- Pennant
- Rectangle
- Triangle
- Triple top
- All
- #AAPL
- #AMZN
- #Bitcoin
- #EBAY
- #FB
- #GOOG
- #INTC
- #KO
- #MA
- #MCD
- #MSFT
- #NTDOY
- #PEP
- #TSLA
- #TWTR
- AUDCAD
- AUDCHF
- AUDJPY
- AUDUSD
- EURCAD
- EURCHF
- EURGBP
- EURJPY
- EURNZD
- EURRUB
- EURUSD
- GBPAUD
- GBPCHF
- GBPJPY
- GBPUSD
- GOLD
- NZDCAD
- NZDCHF
- NZDJPY
- NZDUSD
- SILVER
- USDCAD
- USDCHF
- USDJPY
- USDRUB
- All
- M5
- M15
- M30
- H1
- D1
- All
- Buy
- Sale
- All
- 1
- 2
- 3
- 4
- 5
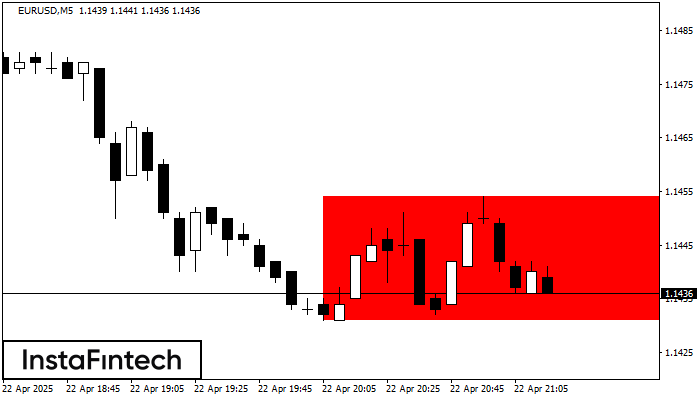
Según el gráfico de M5, EURUSD formó el Rectángulo Bajista. El patrón indica la continuación de una tendencia. El límite superior es 1.1454, el límite inferior es 1.1431. La señal
Los marcos de tiempo M5 y M15 pueden tener más puntos de entrada falsos.
Open chart in a new window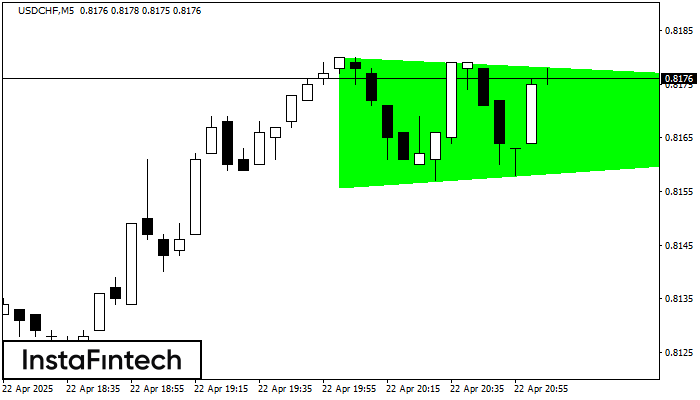
Según el gráfico de M5, USDCHF formó el patrón Triángulo Simétrico Alcista, que señala que la tendencia continuará. Descripción. El límite superior del patrón toca las coordenadas 0.8180/0.8170 donde
Los marcos de tiempo M5 y M15 pueden tener más puntos de entrada falsos.
Open chart in a new window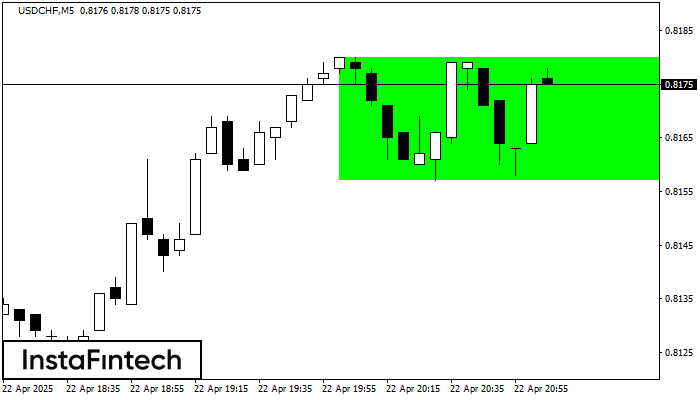
Según el gráfico de M5, USDCHF formó el Rectángulo Alcista que es un patrón de la continuación de una tendencia. El patrón está contenido dentro de los siguientes límites
Los marcos de tiempo M5 y M15 pueden tener más puntos de entrada falsos.
Open chart in a new window